Thursday, September 12, 2013

Clearone Communications: One Year Later, Zero LT-Debt, Improving Margins, The Upside Continues

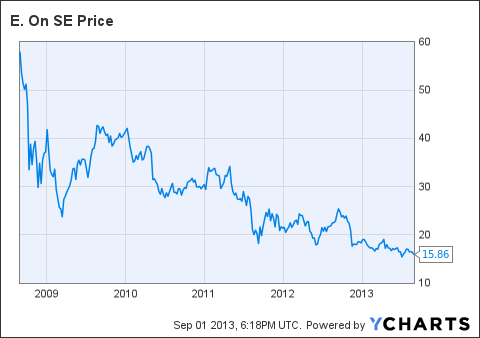
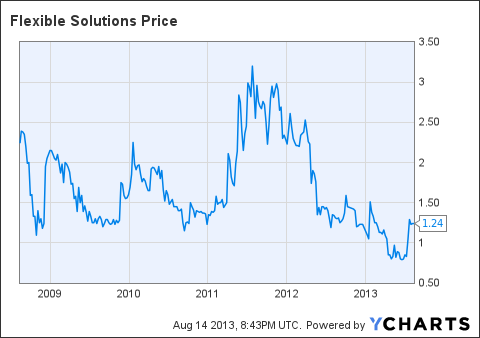
Exactly one year ago from today, I published a brief article covering Clearone Communications, Inc. (CLRO), which was a company I had recently purchased at the time. When the article was released, CLRO was trading right around $4 per share, and my cost basis was relatively the same. As you will see, CLRO's security price has appreciated quite a bit since then, and it now trades right above $8.00 per share.
(click to enlarge)
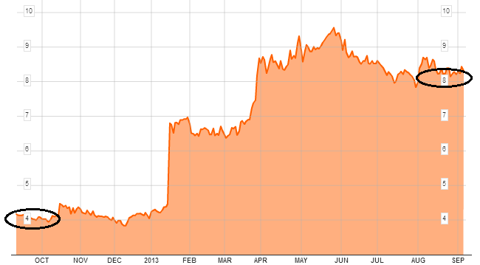
My original thesis behind investing in CLRO was a combination of several things, including its attractive valuation, management's history of adding value through acquisition, and simply its grow potential within the industry. Watching CLRO excel over the last year has really allowed me to reflect on my initial investment thesis, and overall, my thesis remained fairly accurate. While I was correct with respect to its intrinsic value being more than its market value at the time, CLRO's potential to quickly excel in the market was really what it had going for it. CLRO was a true growth candidate simply waiting to take off, and it did just so.
One year later, CLRO's operational performance has truly surprised me. Today, a number of its operating and valuation metrics remain appealing, which makes me wonder how much more upside potential investors can capitalize on in 2013. Regardless, over the next two years, CLRO clearly has room to continue growing, and its operations are more than capable of adding additional value for shareholders'. This article is going to provide a brief overview of its business model, highlight operating as well as financial performance, and conclude with several forward looking valuation estimates.
The Business
CLRO was founded in 1983 where it was incorporated in the state of Utah. Today, its headquarters remain in Utah, while its office are spread throughout the United States, Hong Kong, the United Kingdom, and Israel. As you may already know, its business model revolves around the design and development of solutions to enhance the feasibility of conference calls, collaboration efforts, streaming, and digital signage solutions for audio as well as visual communications. CLRO's end goal is to provide solutions to clients that offer a high level of functionality, ensure reliability, yet incorporate features that make these solutions user friendly. For reference, here's is two of CLRO's popular solutions, the "Collaborative Desktop" and the "Collaborate Room."
CLRO's line of conferencing products are catered to a wide variety of markets including individuals for personal use, premium packages for small businesses, and higher-end professional products for large corporations. At the end of 2012, CLRO's management announced that its operations control roughly 50% of the market share in the professional audio conferencing market for products used by large businesses. The large businesses and organizations that comprise this customer base include enterprises, healthcare, education and distance learning, government, legal, as well as financial institutions. The solutions provided across this segment not only save client's time, but serve to greatly reduce costs. Overall, the need for conferencing solutions is widely popular among large business in today's' world. CLRO has successfully penetrated the market up to now, and given its high level of continuous innovation, its likely CLRO will continue to penetrate this growing market even further in 2014.
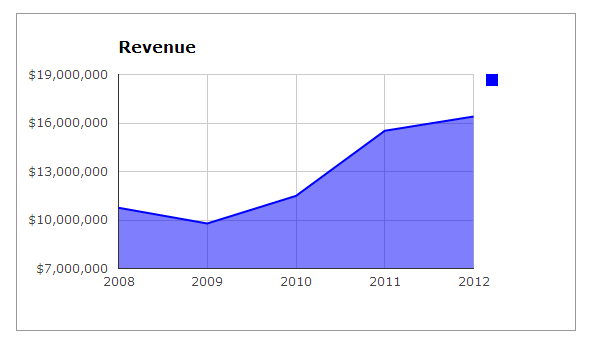
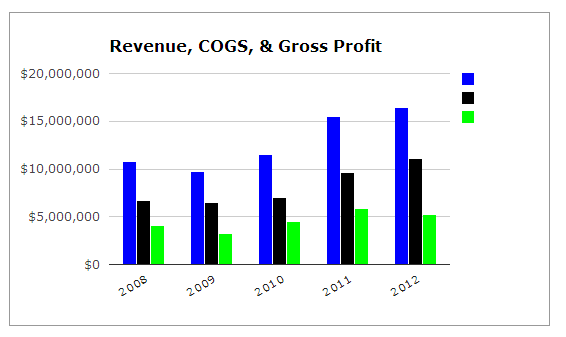
As you saw earlier, its share price experienced a significant increase YoY, and its revenue did as well. Let's take a look at CLRO's quarterly revenue growth over the last five years, but for the purpose of this analysis pay close attention its growth in the last two years.
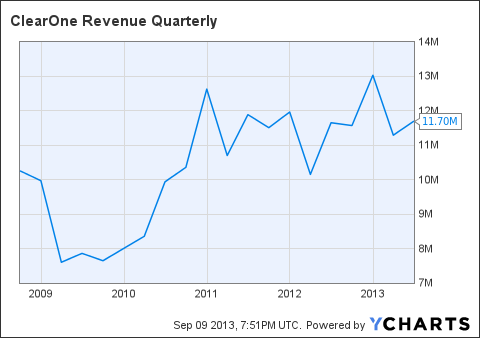
CLRO Revenue Quarterly Chart
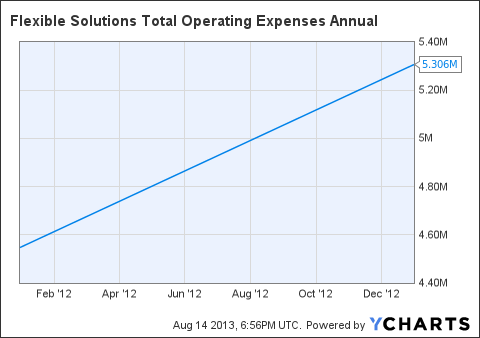
Since 2010, you will see that CLRO's revenue has really taken off. For year end 2012, total revenue came in at $46.42mm, and after expenses its net income was $26.65mm, which provided shareholders' with $2.89 in earnings per share. In my opinion, that's quite favorable from an investment standpoint. The primary reason for this is its operating expenses are typically fairly low as it is, and were extremely low for 2012 in particular. Total operating expenses in 2012 were only $3.90mm, which made its operating margin pretty attractive at almost 92%. Looking forward, I anticipate CLRO's revenue to be substantially higher than what it came out to for 2012. On a quarterly basis, revenue for 2013 has already came out to $11.29mm and $11.70mm for Q1 and Q2, respectively. And typically, based on historical trends, its revenue tends to be higher in the last two quarters of each year. On the expense side, CLRO looks as if it will sustain an operating margin that's slightly lower as it continues to expand its business. However, from a profitability standpoint, its operations add sufficient value to still provide a feasible investment for shareholders'.
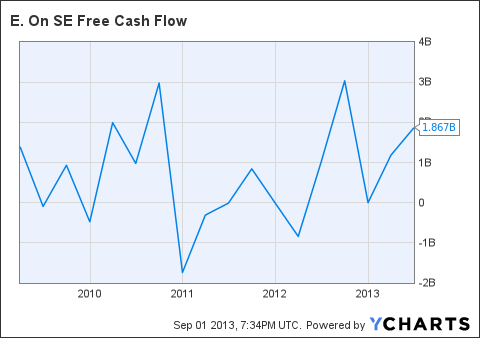
We've seen CLRO's ability to increase the magnitude of its business through sales growth, but its important we evaluate its earnings strength. Let's start by taking a look at its operating cash flow for the past couple of years. Its important to that CLRO's is currently in a growing stage, and in this stage, operating cash flow has a tendency to fluctuate quite a bit. However, on a positive note, you will see below that CLRO's cash flow generated by its operations has grown pretty well. Unlike net income, operating cash flow cannot be distorted with accounting shenanigans. Its a sign of real earnings and it's one sign the CLRO has the has the capability of sustaining its operations in the long-run.
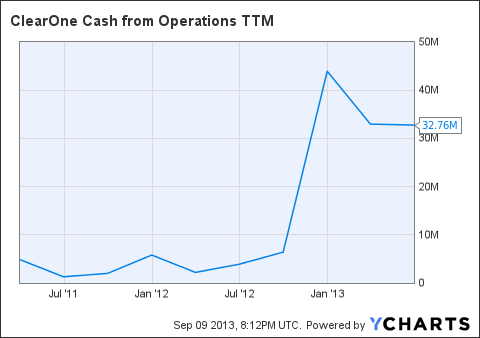
CLRO Cash from Operations TTM Chart
One more thing I would like to point out before getting into CLRO's valuation is its operating strength. In addition to its operating profit, all three metrics including its return on assets (ROA), return on equity (ROE), and return on invested capital (ROIC) are substantially high. All three metrics are a solid indication of its ability to generate a return on capital invested into the company in different forms.
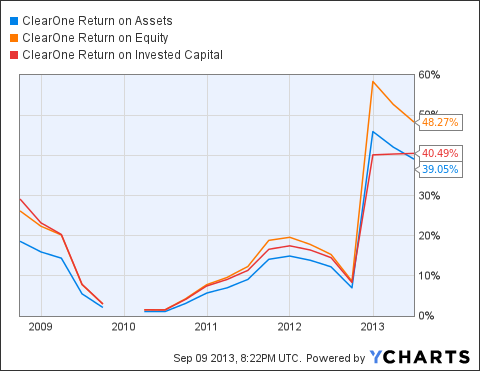
CLRO Return on Assets Chart
Valuation
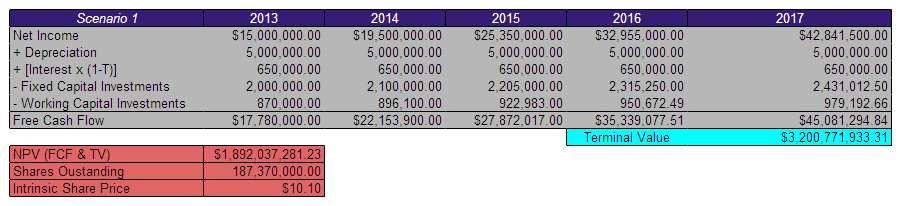
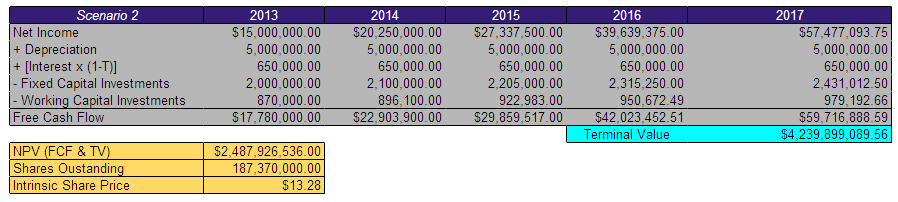
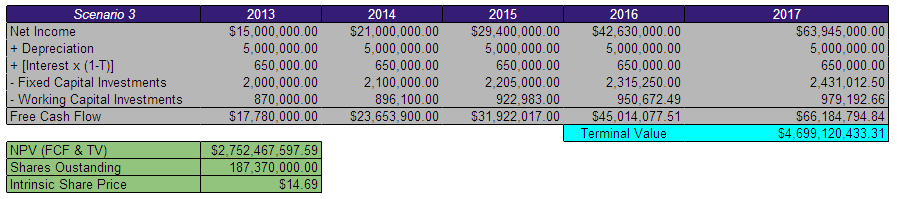
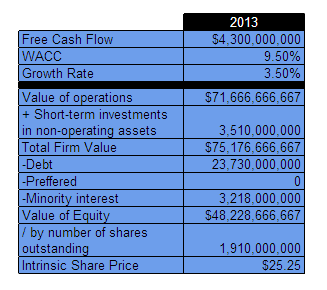
Given the recent fluctuations in CLRO's price, market price-based multiples such as the P/E ratio become rather difficult to use and make valuation a little tricky. I am going to use a variation of the corporate valuation model to provide investors with a current intrinsic share price estimate based of its current free cash flow trailing to maturity as well as a conservative estimate for the end of 2013. The inputs in the model are highly conservative and yield estimates that are quite favorable from an investment standpoint. But first, I would like to discuss CLRO's balance sheet and highlight several items that play a role in determining its intrinsic value.
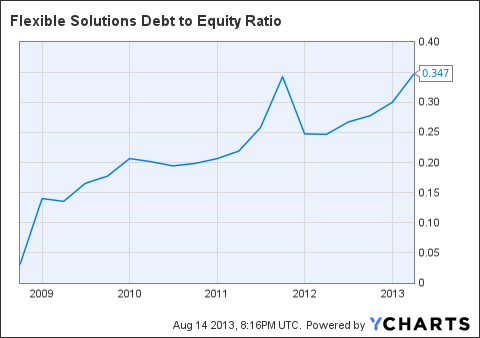
Over the last year, CLRO's balance sheet has improved quit a bit, and as CLRO continues to acquire more market share within the industry, the strength of its balance sheet is improving as well. First starters, its important to note that CLRO has zero long-term debt outstanding, and only liabilities on its balance sheet has decreased by more than 50% over the last six months. Right now, the total amount of liabilities on its balance sheet only $11.73mm, and of that total, $9.34mm is current liabilities including accounts payable, notes payable, and other short-term debt obligations. Furthermore, only $2.39mm of its total liabilities are long-term, and these are classified as other long-term liabilities. In order to provide an accurate estimate for its current intrinsic share price and a conservative estimate for the end of the year, I have included the amount of its other long-term liabilities under net debt in the model. I also modified several other of the inputs in the model to ensure the estimates are not far fetched, and when I am done, some of you may still beg to differ.
First, I started by making a slight adjustment to the figure I used for the risk-adjusted discount rank. As previously mentioned, CLRO has zero long-term debt and very few liabilities as it is. As a result, we can infer its capital structure is idea and of relatively low risk, however, this also produce an artificially low figure for CLRO's weighted average cost of capital (WACC). To counter this, I used the average WACC of several other firms in the industry, which is what CLRO's WACC would have been closer in the case it was slightly more leveraged in terms of debt. Next, I had to decide the amount of free cash flow to use for its current and year end estimates. For the current estimate, I used its free cash flow trailing to maturity, which came out to $32mm. For the 2013, I used an amount I projected based off of its expected operating cash flow for the next two quarters, and I arrived at $38mm. The last input that provided room for variation was the perpetual growth rate. And for this input, I used 0.50%, which is extremely low. Overall, the estimates used in the model were highly conservative, however the end results are shocking.
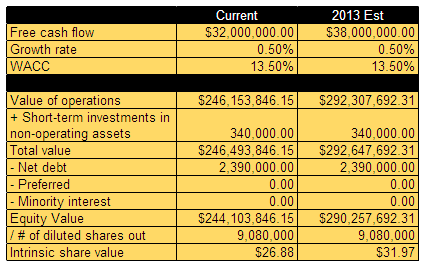
As you will see, the current intrinsic share price estimate is $26.88, and the estimate for the end of 2013 is $31.97. Although both estimates seem very unrealistic, this is the true per share value of CLRO's operating given its capital structure and the amount of free cash flow its operations have generated. One of the main reasons CLRO continue to remain deeply undervalued is the overall lack of knowledge among market participants. Being a small capitalization company, its incredible easy for CLRO to stay under the radar. However, its only a matter of time before its businesses expansionary measures take effect, and force investors to recognize its solid business model. Looking forward, I anticipate CLRO's operations to continue growing. And while these intrinsic share estimates may be a year or two away from being priced into the market, its operations sustain a much higher market value than the current $8 per share.
Bottom Line
The bottom line is CLRO is a small capitalization company with one of the best reward to risk opportunities I have seen in a while. Typically, with small capitalization companies there are many unusual risks that normal companies are not faced with, however with CLRO, that is not the case at all. CLRO's operation generate a sufficient amount of operating cash flow, and given the low level of regular capital expenditures, there is plenty of free cash flow available to the firm. Additionally, CLRO is in a unique, and rare financial position for a firm in its early growth stage. It has zero long-term debt on the balance sheet, and as I mentioned earlier, only $11.73mm in total liabilities, which are mostly current items that CLRO can easily fund through its high level of liquidity. In terms of market risk, its six month holding period returns reveal a beta of 0.60, which indicates its returns present a low level of volatility, and overall, make it an investment of relatively low risk considering the market has a beta of 1.
It's now easier to understand why its share priced doubled from its value a year ago from today. Going forward, I expect CLRO to gain further market share and generate a substantially higher amount of cash flow from operations along the way. The current market value of its operations is roughly $75mm, and given the estimated intrinsic value of its operations right now is closer to $250mm, it would not be a stretch to see its total market value increase to $150mm over the next year. For investors, the reward clearly outweighs the risk in this situation, and it would not surprise me if CLRO's share price in the market was to double in the next year.
Sources: TD Ameritrade, FinViz, YCharts, CLRO's Company Website, Google Finance, Yahoo Finance, Morningstar, and sec.gov.

Arabian American Development Co.: Lucrative Resources, Low Debt, 60%-70% Near-Term Upside

So far, I have written about Arabian American Development Company (ARSD) a couple of times, and as I expressed before, it is definitely a company that deserves far greater attention in the market than it currently receives. My first article outlined seven reasons why ARSD is a solid buy, and the intent of my second article was to articulate why ARSD deserves a significantly higher market valuation. Since the publication of these two articles, ARSD's share price experienced slight appreciation breaking the $10 mark; however, it has still failed to reach its intrinsic value. Furthermore, its share price recently experienced a strong pullback, and now offers an excellent entry point for investors who would like to capitalize on a feasible growth company. Today, I am still surprised that with the elaborate nature of ARSD's operations, the company's business model remains vague and unknown by many market participants. And although ARSD's operation commands a significantly higher market valuation, the overall lack of transparency, specifically investors' awareness and knowledge of general information about the company remains the primary reason its stock price receives the attention it does.
From an operational standpoint, ARSD's performance is sound. Its operations sustain the ability to generate real earnings, which can be seen through adequate levels of operating cash flow. In terms of stewardship, its management is highly dedicated and exhibits a high degree of financial discipline through its ability to maintain a very low amount of debt, yet has the capability to fulfill any funding needs. To top that off, the combination of the high demand displayed by its end consumers along with the lucrative resources at its disposal place growth potential far above its competitors. Without a doubt, ARSD"s common shares have the potential to trade at easily 3-4x current market valuation from now. In this article, I will place a greater emphasis on growth potential to derive from ARSD's 37% interest in the AL Masane Al Kobra Mining Company (AMAK), which is a mining company in Saudi Arabia. Additionally, I will elaborate on its extensive customer base that feeds directly as the end consumers of both the resources retrieved from AMAK as well as the specialty petrochemical products manufactured at its in-house production entity known as South Hampton Resources. Finally, I will provide investors with a scenario analysis revealing its valuation in several different cases, and to conclude, I will address a few of those concerns investors may have going forward.
ARSD's Most Lucrative Growth Prospect Is Not Well Known
As many of you may already know, ARSD is a basic materials company specializing in the manufacturing and sale of specialty petrochemicals. For this segment of its business, its operations are conducted entirely in-house at South Hampton Resources. South Hampton Resources is ARSD's 115 acre facility in southeastern Texas, and also serves as the company's headquarters. Even though ARSD did not become incorporated until 1967, the early development of its petrochemical business originated at this very same location in 1955. With over 60 years of experience, ARSD now serves its customers as an industry leader and is capable of providing a large degree of flexibility for satisfying the demand for goods that are highly specialized in nature.
At the moment, the real value being added to ARSD in a material form on the income statement primarily derives from the divine need for these specialty petrochemical products. However, ARSD's vested interest and ownership in mining properties outside of the United States is a critical part of its business that will be the ultimate source of value in the future. Overall, I feel this aspect of its business is not well known. These properties are rich in terms of resources, allow for enhancements on the profitability side, and position ARSD in an excellent position for future growth in years to come.
One of ARSD's largest projects, and the most lucrative in my opinion, is the Al Masane project. This project is located in Saudi Arabia and is being conducted by the Al Masane Al Kobra Mining Company (AMAK), which is a closed joint stock mining company that ARSD owns 37% interest in. This company was formed with the combined effort of ARSD and eight individual Saudi investors. Today, AMAK specializes in the commercial production of copper and zinc concentrate. For reference, here's an image of the facility and the surrounding property.
In addition to the facility you see above, the ongoing Al Masane project covers 44 square kilometers in southwestern Saudi Arabia. The rights to this amount of land was issued through a 30 year lease agreement with the Saudi government that was commenced in May of 1993. With ten years remaining in the lease agreement, there is quite a length of time for ARSD to continue utilizing the resources that exist on this land. In a worst case scenario, the lease contains a renewable option allowing for an extension for any period up to 20 years. Overall, AMAK has provided a large amount of diversification to ARSD's operations, and has also provided the company with the luxury of being able to engage in exploration work in other areas discovered in Saudi Arabia.
Going forward, it's critical that investors not only keep a close eye on the aggregate outcome of the project, but specifically the output of resources along the way. Therefore, as the project begins to provide a return in excess of the capital invested in the project, investors should expect a dramatic spike in profitability. Most likely, this will occur in a specific quarter fully at once, but the beginning signs of it should be translucent enough to gauge along the way. The profitability enhancement from this project will add tremendous firm value in the long run. Furthermore, management at ARSD and the Saudi investors have already expressed interest in taking AMAK public, and decided that will not take place until at least two years after the Al Masane project begins turning over a significant profit.
The second resource ARSD has is a large chunk of interest (55%) in PEVM. Right now, PEVM is an inactive corporation, but the ownership of this includes rights to 48 patented and 5 unpatented claims, which totals to approximately 1,500 acres. The claims are all located in Lincoln County, Nevada. Following a revaluation of these assets, a write down just shy of $500,000 was recorded as impairment in 2008, and since, there has been no additional write offs for impairment. Overall, ARSD's interest in PEVM is not by any means comparable to its stake in AMAK, and management has already stated they have no intentions of further developing these mineral properties. So from a shareholders' standpoint, PEVM's only relevance is simply the underlying asset value of this ownership, which down the road can be sold to generate additional cash if need be.
A Growing Customer Base That Prospers From Brand Names
Generally speaking, it's common for high margins to derive from brand names. ARSD's customers thrive off brand names. Therefore, as a whole, ARSD's margins will continue to rely on the reputation of the large assortment of brands used by its customer base. ARSD's specialty petrochemical products are directly sold to a number of large, yet well-known public as well as private companies based in the United States. Just for reference, some of these companies include Exxon Mobil (XOM), DuPont (DD), 3M (MMM), Dow Chemical Company (DOW), Baker Hughes (BHI), Dart, NOVA Chemicals, Chevron Phillips, Imperial Oil (IMO), Calumet (CLMT), Advance Romantics, Chevron (CVX), and Lyondell (LYB). Here are a few more:
From the standpoint of these companies, ARSD is a critical supplier. With the combination of the unique attributes of these products and the high degree of specialization, ARSD's customer base is not willing to settle for lower quality. In most cases, its customers have a brand name to uphold, and preserving the reputation requires using ARSD's specialty petrochemical products. Over the years, the relationship ARSD has enriched between its customer base is an intangible asset of its own. ARSD is in a vital position to continue growing, enhance profitability, and overall, simply continue operating as a long-term supplier for its customers. Overall, ARSD's business model incorporates a large amount of sustainability internally, which is critical for generating profits in the long run.
Valuation
Over the last two years, ARSD's share price has fluctuated quite a bit, which makes price multiple based valuation techniques seemingly difficult to apply at times. However, to just paint the big picture, I have provided a graph illustrating the fluctuation in ARSD's P/E ratio as well as its EV multiple for the past couple of years. Below, you will see that ARSD's current P/E ratio is right around 13.31x, which is slightly lower in contrast to the industry average. On the other hand, its EV multiple is right around 8x, which is relatively fair for the industry in which it operates.
ARSD PE Ratio TTM Chart
In addition, ARSD is undervalued on the basis of its P/B ratio. Right now, its P/B ratio is extremely low at roughly 0.80. Ideally, ARSD is a company that will approach fair value when its market price reflects a P/B ratio closer to 1.5x. ARSD's primary competitor, Phillips 66 (PSX), consistently trades at a P/B of about 1.6x, which is perceived to be right around the industry average.
In order to place a fair value on ARSD's common stock for the end of 2013, I constructed a series of discounted free cash flow models using different scenarios to reflect the impact of using different growth rates. Each scenario is highly similar in nature, except for the rate at which net income grows. For the risk-adjusted discount rate, I used ARSD's weighted average cost of capital of 12%. Additionally, in computing the terminal value, I took into account a perpetual growth rate of 5%. And the last assumption I used was a corporate tax rate of 35%, which was used for computing the after-tax interest expense needed to derive the free cash flow estimates. As you will sell below, each scenario has been labeled from 1 to 3, which reflects the worst to best case scenario.
Scenario 1: The Worst Case, 30% NI Growth YoY
(click to enlarge)
This scenario suggests an intrinsic share value of $10.10 for the end of 2013, which is roughly 29% higher than ARSD's current market value per share. I used this scenario for the worst case because I anticipate earnings to grow by at least this amount on average over the next four years. Realistically speaking, firms do not grow at the same steady rate year after year, and I do realize that. So I modeled two different scenarios where the growth rate changes, and as you will see, they tend to be on the more optimistic side of things. But overall, the worst case scenario still implies an intrinsic value that is above ARSD's current share price in the market.
Scenario 2: The Mediocre Case, 35% NI Growth in 2014 & 2015, 45% NI Growth in 2016 & 2017
(click to enlarge)
This second scenario reveals how a change in the rate at which its earnings grow can have a major impact on valuation. While the growth rates still remain conservative for a small capitalization company in its early growth stage, the intrinsic share price given the assumptions in this scenario is far more appealing than scenario 1. The intrinsic share price estimate for the end of 2013 in this scenario implies ARSD's fair value is nearly 70% higher than the market has priced it at, which I perceive to be fairly accurate.
Scenario 3: The Best Case, 40% NI Growth in 2014 & 2015, 45% NI Growth in 2016, and 50% NI Growth in 2017
(click to enlarge)As you will see, not a lot has changed. The slightly higher growth rate used in the initial years had very little impact compared to the high growth rate in the final year. This scenario used three different growth rates, which in reality is far more accurate. The output of this model produced an intrinsic share price of $14.69, which is almost double ARSD's current share price in the market.
Overall, I feel ARSD's true value per share is best reflected by scenario two. Not only do I think its operations support a much higher valuation, but the fact its balance sheet contains hardly any long-term debt makes the company worth a lot more than market participants have priced in. Additionally, ARSD's management has always displayed high level of financial discipline and proven the ability to make decisions in the best interest of shareholders. Conclusively, I think ARSD's true value per share is about 60%-70% higher than its current share price in the market.
Final Thoughts
As we already know, ARSD is fairly well established in the marketplace as a supplier of specialty petrochemical products, and as a result, the level of competition remains minimal. The typical negative factors that source from a competitive environment among producers do not exist. Margin compression is irrelevant, operational performance does not suffer from a cost structure that's constantly changing, and ARSD has only one primary competitor including Phillips 66 . Basically, this allows us as investors to eliminate competitive threats as a major area of concern. Looking forward, it will be important to keep a close eye on its ongoing Al Masase project. This project will be a critical tool for adding firm value in the years to come.
Overall, ARSD is a strong company that is well positioned to be a high-growth candidate over the next several years. Its operations support a product that exhibits a high demand, yet is highly specialized. The level of customization adds reassurance making it extremely difficult for individuals among its customer base to "doctor shop" for what they want. On top of that, ARSD's management is dedicated and maintain a capital structure that is shareholder friendly with barely any debt. Based on its current level of earnings, I forecasted its earnings forward and was able to derive an intrinsic share price estimate for the end of 2013. Using the most conservative inputs, scenario 1 still suggests ARSD's true value per share is 30% higher than what the market currently reveals. Looking ahead, ARSD serves as an excellent investment for individuals with both short- and long-term investment horizons. Patient investors have the potential to capitalize on a 60%-70% return over the next six months.
Sources: TD Ameritrade, Google Finance, Yahoo Finance, sec.gov,ARSD's Company Website, FinViz, and YCharts.

5 Reasons To Consider E.On At Only $16 A Share

E.On (EONGY.PK) is a German-based provider of energy solutions that operates on a global basis. Despite the fact EONGY is traded on the OTC markets, its operations are quite extensive in nature and cover a vast landscape, which not only reduces business risk, but provides the capability for EONGY for sustaining its dominant position as a large market capitalization firm in the industry. This article provides an overview highlighting the key points of EONGY's business model as well as five reasons why it's a solid buy at the discount it's trading at in the market.
Overview
In terms of the solutions provided, EONGY's business model is highly focused on power and gas. Its operations are divided among five global units including Generation, Renewables, Gas, Trading and New Building and Technology that involves engineering related construction of power plants. Its operations are extensive and control the gas and electricity supply for over 26 million customers, which are primarily located in Europe. Additionally, EONGY owns approximately 68 gigawatts of renewable power production capacity.
In the market, EONGY is currently trading right below $16 per share. On a five year scale, you will notice the sharp decline in its price beginning in 2009. The combination of the global financial crisis, collapse in commodity markets, and specifically, the European financial crisis has played a major role in EONGY's security price over. It's clear that EONGY has yet to make a full recovery, but investors need not to worry - change is underway.
EONGY Chart
(Click to enlarge)
EONGY data by YCharts
EONGY's management divested roughly €15bn of assets spread across mature markets including Germany, the U.K., as well as the U.S. Furthermore, as part of the continued effort towards improving its balance sheet, management decided at the beginning of 2013 to invest an additional €5.25bn in countries that do not comprise the eurozone.
Five Reasons To Buy EONGY At Less Than $16 Per Share
#1 The narrow economic moat among regulated utilities in Europe is specifically designed to augment and maximize shareholders' wealth. The regulated utilities industry in Europe currently has economic moat that is relatively narrow. This is primarily due to the contractual agreements between those who provide capital and the regulators across different countries. Individuals supplying the capital have the common goal of maximizing the return on the initial outlay of capital, while the pricing structure for these services is oriented towards minimizing the cost for end consumers. Although a narrow economic moat in this particular situation may be perceived as unfavorable, it's important to recognize that investors such as venture capitalists are well positioned with the capability of generating high returns. And more importantly, the recent addition to EONGY's business model will enable it to profit in the industry from an entirely different angle. In June of 2013, EONGY management decided to begin venture capital activities.
#2 Historically, EONGY's balance sheet has attracted some negative attention. However, management's changes over the course of the last two years has continues to add vital strength. Within the last five business quarters EONGY's total level of assets has remained relatively the same, however its management has diversified its assets in a sense where more focus is outside of Germany. Additionally, during this period, EONGY has seen a strong decrease in the total liabilities outstanding on its balance sheet. For the period ending June 30, 2012 the total liabilities on its balance sheet stood at about $112.788 bn. Four business quarters later, management was able to reduce this figure to $98.118 bn. EONGY's management has consistently devoted its attention towards improving its financial position and has been successful. Looking ahead, investors should continue to see EONGY's financial position strengthen quite a bit by the end of 2013.
#3 EONGY's financials have improved and investors should expect this trend to continue going forward. The combination of ongoing projects as well as diversified investments in other assets suggests its operations will continue to grow and support a higher level of real earnings. From what was previously mentioned, we already know its operations took a nasty turn in 2009, however several events in 2011 continued to negatively impact its performance and its overall ability to make a full recovery from the economic downturn in 2009. In 2011, the discontinuation of EONGY's operations at multiple plants in Germany took a large toll on its real earnings. This forced a short-term decline in its operating margins and remains priced into its valuation today. As I strongly believe EONGY trades at a severe discount, it's important we take a further look at its free cash flow. This will not only show us EONGY's capability of producing real earnings, but also how its earnings were impacted with the slowdown in 2011. Let's take a look:
EONGY Free Cash Flow Chart
(Click to enlarge)
EONGY Free Cash Flow data by YCharts
For starters, note the figure on the right, $1.867 bn, is EONGY current level of free cash flow trailing to maturity. In 2010, ENOGY made a dramatic recovery and generated right around $3.181 bn in free cash flow before it took a turn in 2011. Just to put this into perspective, on a YoY basis, its free cash flow for 2010 increased by nearly 3.5x from 2009. Now in 2011, its free cash flow decline to $394 mm, which you infer from the graph above. The combination of a widespread recovery across its operation and management's ability to utilize new financing strategies provided EONGY will a speedy recover. Its operations generated $2.429 bn in free cash flow by the end of 2012. Going forward, investors should expect a smaller growth rate in free cash flow YoY, however sufficient enough to expand its intrinsic value of equity.
#4 Simple valuation suggests its common shares are trading at a discount of nearly 60% to current fair value. To arrive at an intrinsic share price for EONGY's common stock, I used a variation of the corporate valuation model beginning with a free cash flow estimate for the end of 2013 of $4.3 bn. Additionally, I used the industry average weighted average cost of capital as the firm's risk-adjusted discount rate and took into account a perpetual growth rate of 3.5%. Both of which, were used in projecting the intrinsic value of EONGY's operations. Following the addition of short-term investments in non-operating assets, I was able to arrive at the total firm value. Then after accounting for debt as well a minority interest outstanding, I was able to drive an intrinsic share price estimate for the end of 2013 of $25.25. This share price estimate implies a favorable upside of roughly 57%.
#5 Analysts seem to be onboard as well. Six analysts who cover this stock have one year mean and median price targets of $26.50 and $26, respectively. In other terms, this suggest a projected upside of roughly 66% and 63%, respectively, which are both highly favorable.
Bottom Line
EONGY remains a dominant player in the industry as a premium provider of power. Its customer base is extensive and covers an adequate landscape large enough to enable EONGY to maintain stable margins. Additionally, the underlying diversification among its business segments is a lucrative feature that will continue to advance EONGY's amount of leverage it has over its peers in terms of competition. The recent venture capital segment that was added on to its business model, will allow EONGY to take advantage of the narrow economic moat the regulated utilities industry appears to have. As previously mentioned, the pricing structure among the industry permits investors to capitalize and generate some of the highest returns, and therefore, EONGY will be able to profit off this segment of the industry going forward. Overall, EONGY is well positioned to excel and provide investors with a favorable return over the next two years. At less than $16 per share, EONGY's common shares offer pretty solid value as they continue to trade at a discount of 60% to fair value. The combination of its improving financial position and favorable outlook on the profitability side, make EONGY a solid investment over the next two years.
Sources: Google Finance, Yahoo Finance, TD Ameritrade, E.On's Company Website, E.On's 2012 Annual Report, and sec.gov.

Flexible Solutions: Increasing Revenue, Low Beta, Potential 60% Near-Term Upside

For quite some time, I have been an avid follower of Flexible Solutions International (FSI). I last wrote about FSI in October of 2012, and since, its volume and share price remained relatively stagnant with the exception of recent trading activity. Following October of 2012, FSI's stock price bottomed out forming a double bottom support line at $0.80 per share. Despite the negative sediment of pure uncertainty that forced this decline, an optimistic outlook surrounding FSI's operating performance was quick to be priced in. And after the release of solid operating results for Q2 2013, strong buying activity forced its share price out of the slums. In order for FSI to be sustainable in the long-run, there's no question its revenue will need to improve. The unique attributes of FSI's products and the niche target market it serves has always intrigued my interest, but my main concern still remains its market potential. While its products fit the suitability of a wide range of consumers, the aggregate amount of revenue its operations generate on an annual basis needs improvement. For FY 2012, FSI's total revenue came out to $16.40 mm, which was lower than expected. Going forward, analysts have reaffirmed guidance for FY 2013 increasing revenue estimates to $17.43 mm, however even if analysts are fairly accurate this is only an increase of about 6% on a YoY basis. And while this is favorable, this level of growth will either need to continue or at a minimum sustain while management reduces its overall operating costs. Conclusively, FSI is a small company with large potential as it has yet to peak in its growth stage. Its operations are profitable and its common shares offer pretty solid value at current market value. Active investors have the potential to captivate on a potential upside in excess of 100%. For starters, here's an overview of its business model.
Company Background
FSI was founded on January 26, 1991 as British Columbia corporation. Roughly seven years later, in 1998, Flexible Solutions International, Ltd. merged with Flexible Solutions International, Inc. As a result, FSI issued seven million shares of common stock to former shareholders of Flexible Solutions International, Ltd in exchange for all of their outstanding shares. Today, FSI operates under a handful of subsidiaries, and while operating through multiple subsidiaries does not heavily influence the core fundamentals of its business, it does however impact the method in which its financial statements are reported, which you will see later on.
Generally speaking, FSI's products are all designed with a similar intent -- conservation. Its products tend to be categorized based on their functionality, but for simplicity, its products can be divided into two categories, including Energy and Water Conservation Products (EWCP) and TPAs. In terms of revenue, its TPAs dominate more than their fair share accounting for the vast majority of the revenue generated by its operations in the United States as well as Canada. In 2012, nearly 95% of its revenue derived from TPAs, and 2011 reveals a break down that's relatively similar. Although EWCPs only make up a small portion of FSI's total revenue, this segment of its revenue is well overdue for growth and provides the largest opportune for expansion. With that being said, let's start with an overview of its products within this segment.
As for EWCPs, FSI manufacturers, markets, and sells these products under several branded names, including HeatSavr™, EcoSavr™ and WaterSavr™. Each brand typically caters to a different target market, however all of its products are highly similar in nature. HeatSavr™ is one of FSI's solutions that is designed to reduce heat loss and evaporation from the surface of the pool that's exposed. Basically, this product is a "liquid solar pool cover" comprised of biodegradable ingredients that create a barrier to slow the heat and water loss that ultimately causes high pool room humidity as well as high heating bills. Below is an image retrieved from FSI's company website showing a before and after image of HeatSavr™ applied to a pool's surface.
(click to enlarge)
Evaporation is one of the primary forms of heat loss from swimming pools and spas, and FSI's HeatSavr™ has been proven to slow evaporation. According to management, tests have proven the heat bill savings can range from as low as 15.5% at a high use 50 meter municipal pool, to as high as 40% at a low use condominium pool. The results will vary from region to region, however HeatSavr™ is guaranteed to save energy in every pool. Overall, the capability for this product to effectively reduce the rate at which water evaporates translates into substantial cost savings. FSI's HeatSavr™ is a cost effective solution that is used at both the private and commercial level. For individuals, FSI's designed EcoSavr™, which is simply a more convenient way for individuals to apply HeatSavr™ to their pool. In addition to being user friendly, EcoSavr™ is also a cheaper alternative that is quite popular among owners of privately owned pools. For further information on EcoSavr, visit Liquid Pool Covers.
In addition to HeatSavr™, WaterSavr™ is another one of FSI's products that is very similar both in terms of its end goal of conserving and its chemical composition. WaterSavr™ contains the same active ingredients that are in HeatSavr™, however the ingredients are in an alternate form that is harmless to the environment and will not contaminate drinking water. In contrast to HeatSavr™, WaterSavr is designed for much larger bodies of water and has been proven to decrease water evaporation by substantially more. According to a recent study:
"Only 2.5% of the earth's water is freshwater, and of that, less than 1% is available as surface water."
(click to enlarge)
Although many individuals across the globe do not see water scarcity as a major issue at the moment, it will become increasingly more important over the next twenty years. FSI's product WaterSavr™ is designed for large bodies of water, which are also the same bodies of water that serve as the primary source of drinking water for surrounding communities. WaterSavr has been proven to effectively reduce water surface evaporation by as much as 50% in a number of different applications, including reservoirs, aqueducts, canals, stock watering ponds, flood water crops, portable water storages, and various agricultural irrigation systems. Additionally, the chemicals in WaterSavr™ have been altered from HeatSavr™. Therefore, WaterSavr™ remains an effective solution for reducing water evaporation that is not only eco-friendly, but cost effective for end consumers.
As mentioned earlier, the other portion, or I should say larger half of its business revolves around the manufacturer and sale of Thermal Polyaspartic Acids, which are also know as TPAs. This segment of FSI's business operates and is managed through its wholly owned subsidiary NanoChem Solutions. FSI's final products are manufactured by NanoChem Solutions and consists of an aspartic acid made in Taber as well as the other aspartic acid FSI purchases from its overseas supplier.
The overall demand for TPAs covers a wide landscape and is continuing to grow. One of the primary uses for TPAs is in agriculture. TPAs are designed to limit crystal embryo growth between positive and negative fertilizer ions in the soil. Therefore, when the embryonic crystals are prevented from transforming into a fully crystalline form by TPA, the fertilizer then remains available at a low energy cost. Basically, its a solution with the capability of enhancing FSI's profitability, while providing customers with a cost effective solution that will substantially reduce energy costs as well as agricultural yields. For instance, treating one acre of land will cost about $20 or less, however, the potential savings for the customer may be in excess of $50 in energy costs along with a larger production yield. According to FSI's management, the wholesale market for crops that are capable of benefiting from the use of TPAs is about $2bn. So far this year, FSI saw a strong decrease in first quarter revenue for TPAs for agriculture use. In addition to TPA use in agriculture, TPAs are also an efficient, eco-friendly way of treating oilfield water to prevent pipes from being backed up with mineral scale.
In terms of revenue, the sale of TPAs has accounted for more than 90% of FSI's revenue over the last two years, which makes it an extremely critical component for FSI's success. In 2011 and 2012, the sale of TPA's generated revenue amounting to $14.4mm and $15.5mm, respectively. Furthermore, this indicates that on a YoY bass FSI saw about 7% revenue growth in this segment alone. Overall, its TPA business is a major growth candidate with large projects in place for the next several quarters. Going forward, FSI's return to investors will heavily depend on the performance of this segment.
Market Performance
In the market, FSI is currently trading right around $1.20 per share, which is just about 13.78x its forward earnings. With the exception of the last month, its average daily volume traded has remained relatively stagnant and investors experienced very little price appreciation until recently. FSI is a small capitalization company with only 13.17mm shares outstanding, which makes its market capitalization approximately $16.33mm. Looking below, you will see FSI's performance over the last five years.
FSI Chart
FSI data by YCharts
From a technical standpoint, FSI is rather attractive. First, its relative strength index (RSI) indication is right around 45, which is considered to be neutral on an overbought versus oversold basis. In case you do not already know, the RSI metric is commonly used to estimate the probability of a upward or downward trend in a security price, and you will find its quite simple to interpret. On a scale of 0-100, an RSI indication ranging between 20-30 suggest the stock has been heavily oversold, while a an RSI of greater than 60 is a sign the stock has been overbought. As we established, FSI's current RSI is neutral and appears to be declining. Right now, while its current RSI does not offer an ideal entry point, its nothing for investors to worry about. As its RSI approaches the 20-30 range, the probability of a dramatic upward trend in FSI's stock price will continue to increase. In addition to its RSI, its simple moving averages are also favorable on a number of durations. Currently, its SMA50 and SMA200 are 23.17% and 9.61% respectively. Overall, FSI's current price in the market is not a bad entry point for active investors, and in terms of share price appreciation, the upside potential is high. For FSI, technical analysis should not be the underlying decision for initiating a long-term position, however it is an excellent tool for achieving a low cost basis on an initial investment.
Financials
As mentioned earlier, FSI's operations are divided between the United States and Canada. Therefore, the revenue generated from each geographical location depends to an extent on the overall condition of the economy as well as external factors pertaining to a specific region. Generally speaking, the majority of FSI's revenue stems from its operations in the United States. However, a fair portion does come from Canada, and it's important that investors recognize this. Below is a chart showing the dollar amount of revenue generated in 2012 and 2011 by Canada and the United States, respectively.
(click to enlarge)
On a YoY basis, FSI's revenue has experienced adequate growth for a growing company. While we would have liked to see a larger increase in revenue from 2011 to 2012, its important to keep in mind FSI is still growing and by no means has reached its full market potential. Here's a graph depicting the changes in its revenue over the last five years:
(click to enlarge)
Despite the miniscule decrease in 2009, its overall revenue growth over the last five years is quite favorable. In 2009, its revenue came out to $9.783mm, and within just four years, its revenue increased by nearly 68% to $16.4mm at the end of 2012. Additionally, FSI is positioned to benefit from improving economic conditions. As we saw earlier, a larger percentage of its revenue is derived from the sale of TPAs. Given these products are widely used by agriculture producers, the fact of whether or not they purchase these products will depend on profitability at their level. In other words, FSI is well positioned to benefit from upward sloping cost curves for any of the crops in which its product can be used. For example, many farmers that produce corn are avid users of FSI's TPAs, and as long as the price of corn remains high enough to where the farmers profit margin allows for it to purchase TPAs, farmer will. This is solely due to the cost savings associated with using the product. Overall, there is a positive correlation between the amount of farmers that use FSI's TPAs and the current price of corps in commodity markets.
Before we shift gears and focus on FSI's balance sheet, it's important we take a look at two more things on the profitability side -- its gross and operating profit margins. Below, you will see I have constructed a comparison of the three accounts, including revenue, cost of goods sold, and gross profit. Excluding 2009, you will see that FSI's gross margin experienced relatively fair growth throughout 2011, and then declined in 2012 even though its revenue continued to increase. As you can see, this can be attributed to a higher cost of goods sold for this period, which was not proportional with respect to the increase in revenue.
(click to enlarge)Furthermore, FSI's operating income in 2012 suffered as well due to changes in its cost structure. Across the board, its operating expenses in 2012 increased to $5.306mm from $4.546mm, which is an increase of almost 17%. Let's take a look:
FSI Total Operating Expenses Annual Chart
If you were to take a look at the various items under operating expenses on its balance sheet, there are not any items that reveal a distinct variation from YoY, except for its administrative salaries and benefits, which increased quite a bit. In 2011, FSI expensed $362,807 for administrative salaries and benefits, and in just one year, this figure increased by almost 120% to $792,927. In my opinion, that was simply too much. Going forward, I do not expect to see any further increase of any significance in this account. So far in 2013, its financials for the first two quarters reveal little variation in its cost structure, which I expect to continue.
Next, it's important we take a look at FSI's balance sheet in order to understand its capital structure. This will also help us determine its position in terms of both solvency and liquidity, which are both essential for growth in the long- and near-term, respectively. Historically, FSI's capital structure has been strong and relatively comparable to other firms operating within the same industry. Right now, its current capital strucutre supports a debt to equity ratio and long-term debt to equity ratio 0.34 and 0.13, respectively. Both of these metrics are considerable low and highly attractive on a stand alone basis. Below you will see that over the last five years its debt to equity ratio has increased slighly, but becuase it's still so low, it's nothing investors need to worry about.
FSI Debt to Equity Ratio Chart
Furthermore, its important to note that FSI's short-term working capital policy is adequate, which suggests FSI is not at risk for experiencing any short-term liquidity issues. Also, as you saw, FSI's long-term debt to equity is fairly low. And given its little need to acquire additional or extend pre-existing long-term debt issuances, we can assume its solvency is sufficient enough to sustain operating in the long-run. In order to be sure, let's take a look at its current and interest coverage ratio, which both reflect short- and long-term liquidity needs.
FSI Current Ratio Chart
As you will see, both ratios are favorable and do not signal any concerns. Its current ratio is above two and its interest coverage ratio (EBIT/Interest Expense) is favorable high at 14.11. Typically, an interest coverage ratio is not this high, however it tells us that FSI is more than capable of making any interest payments on long-term debt that come its way. Additionally, a high interest coverage ratio is beneficial for FSI because it provides management with the ability to take on a higher interest expense without an issue, and recently, this has been the case. And over the last five years, you will see that its interest expense has increased quite a bit.
(click to enlarge)
Valuation
As you saw earlier, FSI's stock is trading right around $1.24, and at this price, its common shares offer pretty solid value for active investors looking to capitalize on a simple market inefficiency. Broadly speaking, the stock is clearly undervalued and the upside potential is quite favorable, yet more importantly -- realistic. This next section will provide investors with a forward looking perspective of what to expect over the next six months in terms of FSI's share price.
It's important to recognize that traditional stock valuation techniques used for a firm in its early growth stage can produce outputs that are often unfavorable or unrealistic. For instance, the presence of negative free cash flow is fairly common among firms in this stage, and it's a prime example of one attribute that can make valuation a little tricky. Right now, FSI's free cash flow trailing to maturity is negative, but should not be a major area of concern.
FSI Free Cash Flow TTM Chart
In practice, the interpretation of negative free cash flow usually suggests two things: a firm is not generating real earnings or it's pumping excess capital into capital expenditures to fund growth options. Historically, FSI has been capable of generating real earnings, and its operating cash flow generated in the past exists to reflect this. Although its current earnings could be better, the primary reason FSI's free cash flow is negative is because the firm is still growing. For growing firms, it's quite common to see very little, if any positive free cash flow. Varying amounts of capital expenditures and investments in operating assets from quarter to quarter tends to deteriorate the stability of free cash flow for these firms. Therefore, valuation models that use free cash flow will likely yield skewed estimates. However, in order to avoid these complications, I used a modified version of the asset-based valuation approach.
To start, I took FSI's current total asset and liability figures and adjusted these figures to exclude depreciation on the asset side as well as short-term accounts payables in the current portion of the total liabilities. After taking the difference between total assets and liabilities, I divided the figure by the total of common shares FSI currently has outstanding. These calculations allowed me to arrive at a asset-based share price value of $1.19. Now if w assume that FSI continues to trade at its average price to book ratio of roughly 1.7x, this suggests FSI's implied share price should be around $$2.02. This is the theoretical price of what FSI should be trading in the market at. In other terms, this also suggests that FSI is currently undervalued by about 60% in the market. Additionally, as FSI's operating results continue to improve over the second half of 2013, I would not be surprised if this inefficiency is quick to become priced in.
Risk Assessment & Investor Concerns
FSI's management clearly has a strong interest in the company and I do not see the potential for any risk to arise from management's interest being misaligned with the interest of shareholders'. Below is a chart I retrieved from FSI's 10-K for the period ending December 2012. As you will see, a total of six insiders own 48.6% of FSI's common shares outstanding. Over the last two quarters, there has been relatively little change. These six insiders still own roughly 48% of all FSI's common shares outstanding.
(click to enlarge)
Focusing on business and operational risk, there are a couple of things investors need to take into consideration. First, FSI's large dependence on few select customers has the potential to be a game changer in terms of revenue. Adverse economic conditions across industries in which its end consumers operate can heavily influence sales growth and cause inventory to pile up. FSI has started to expand its customer base, but is currently an ongoing process. Second, the performance and volatility in commodity markets has to an extent an impact on the sale of TPAs. Given the vast majority of its TPAs are sold to consumers in the agricultural industry, the price volatility of commodities such as corn has the potential to influence sales. TPAs are beneficial for farmers who cultivate a wide variety of crops because they are a cost effective means for conservation and increasing agricultural yields, however the price of crops must remain high enough to where its worth while for farmers to continue purchasing the product for there benefit.
In terms of the risk associated with FSI's stock in the market, it reveals a relatively low level of volatility for a small capitalization company. Using FSI's holding period returns for the last two years, I regressed its returns with respect to the returns of the S&P 500 to provide investors with a quantitative risk metric for comparative purposes. The regression function revealed a firm specific beta for FSI of approximately 0.85, and given the market is to be considered neutral with a beta of 1, this is extremely low.
Bottom Line
FSI is small company and has by no means reached its full market potential. FSI's strong capital structure will continue to provide its operations with the funding necessary to meet any short-term liquidity needs. Additionally, solvency is not an issue and FSI is in a strong position with the capability of financing its operations in the long-run. Although the several changes made to its cost structure in the latter part of 2012 set back its operating margin from the previous year, its revenue continued to increase YoY and I do not foresee another increase in operating expenses for this year like we saw previously.
At just above $1.20 per share, FSI offers substantial upside potential. From an investment standpoint, its low level of volatility suggests minimal downside risk for active investors who wish to capitalize on short-term trades. However, the cost effective solutions provided by its highly specialized product line make it a long-term investment that's highly worth considering.
Sources : Google Finance, Yahoo Finance, FinViz, Bloomberg Market Data, YCharts, FSI's 10-K retrieved from sec.gov, FSI's Company Website, and FSI's Product Brochures.