Tuesday, July 23, 2013

ENGlobal: A Deeply Undervalued High Reward Growth Play

ENGlobal (ENG) is a small capitalization company operating as a provider of engineering and various specialty services for companies within the energy sector. Despite the inherent volatility that's commonly associated with small capitalization companies, ENGlobal presents a different story. In terms of operations, its business risk is minimal and its growth potential is tremendous. Right now, its common shares offer pretty solid value as they continue to trade at a severe discount to intrinsic value. The suppressed valuation also provides investors with an adequate level of downside risk protection. Clearly, a feasible investment exists, but it's important to realize that it is only a matter of time before active market participants begin to exploit this simple market inefficiency. Within the next six to twelve months, I believe ENGlobal could see a substantial upside. An upside in excess of 100% is not out of the question. Actually, it's highly probable - and shortly, you will see why. This article will give an overview to ENGlobal's operations focusing specifically on its historical and recent performance. In addition, it will place an emphasis on its valuation and highlight the key differences between its market and intrinsic value investors need to be aware of. For a good primer, here's an overview of ENGlobal's business.
Background
EnGlobal was incorporated in the State of Nevada in June of 1994. Since, it has operated as a major service provider to its wide range of customers primarily concentrated in the energy sector. In terms of geographical placement, its operations are quite diverse and cover a vast landscape. As of the most recent reporting period, ENGlobal has roughly 1,700 employees in 15 offices located in six different states including Texas, Louisiana, Oklahoma, Colorado, Alabama and Illinois. For simplicity, ENGlobal's operations can easily be divided into two segments including:
  1. Engineering and Construction
  2. Automation
The Engineering and Construction Segment incorporates all the services related to the development, management and execution of projects requiring professional engineering to the midstream and downstream sectors throughout the United States. According toENGlobal's 10-K, the services provided within this segment include the following:
  • Conceptual studies
  • Project definition
  • Cost estimating
  • Engineering design
  • Environmental design
  • Environmental compliance
  • Material procurement
  • Project and construction management
  • Facility inspection
For this segment, the services listed above are provided to customers through one of its two wholly owned subsidiaries including:
  1. ENGlobal U.S., Inc.
  2. ENGlobal Government Services, Inc.
The ENGlobal U.S., Inc. subsidiary focuses on providing its services primarily to midstream and downstream segments of the oil and gas industry, chemical and petrochemical manufacturers, utilities and alternative energy developers. In addition, this subsidiary works on a wide range of energy infrastructure projects in the U.S. These projects entail services related to construction management, process plant turnaround management as well as plant asset management. TheENGlobal Government Services, Inc. subsidiary provides automated fuel handling systems and maintenance services to branches of the U.S. military and public sector entities. The customer base of this subsidiary includes government agencies, refineries, petrochemical and process industry customers around the world.
Overall, this entire segment is far more labor than capital intensive. With that being said, ENGlobal's operating performance is heavily dependent on its ability to generate revenue and maintain cash flows in excess of cost required to sustain its operations, pay employees and cover any additional SG&A expenses. In terms of revenue, the Engineering and Construction segment is by far ENGlobal's largest segment. The revenue generated from this segment derives from contracts. This segment has an existing blanket service contract which it provides clients with either services on a time-and-material basis or with services corresponding to a fixed-price that is agreed upon in advance. Typically, about three-fourths of annual revenue is generated from this segment. In 2012, 74.1% of its revenue was derived from this segment, which is the equivalent of $168.93 mm. Although the Engineering and Construction segment is ENGlobal's large source of revenue, its Automation segment was the only portion of its business to produce a positive operating profit in 2012. The combination of high operating costs and work pushed forward have not only increased the amount of backlogged work, but had a major impact on its 2012 operating performance.
(click to enlarge)

The Automation Segment provides services pertaining to the design, fabrication as well as implementation of process distributed control systems, analyzer systems, advanced automation, information technology, electrical and heat tracing projects primarily to the upstream and downstream sectors throughout the United States. In addition, this segment of caters to specific projects for customer needs in the Middle East and Central Asia. The automation segment only constitutes about a quarter of ENGlobal's total revenue. Therefore, the performance of this segment has a significantly smaller impact on ENGlobal's business as a whole. In addition, the growth in this segment is seemingly smaller than its engineering and construction segment, which is reflected by the decline in the proportion of its revenue from this segment from 2011 to 2012. In 2012, the revenue generated from this segment was roughly 25.9%. Below, you will see the decline in its revenue from 2011 to 2012.
(click to enlarge)
For both segments, we saw a decline in total operating assets on a year-over-year basis. The total assets for its Construction and Engineering segment decreased by nearly 33%, while total assets for its Automation segment only saw about a 2% decrease. Despite the large decline in total assets for its larger segment, the magnitude of this impact is still not significant enough to heavily influence ENGlobal's fair value. Going forward, I expect ENGlobal's Engineering and Construction business segment to experience the most growth in terms of revenue generated and return on capital invested in this segment of its business. Also, I anticipate the revenue generated from its Automation segment to remain relatively the same.
Switching gears for a minute, let's take a look at ENGlobal's performance in the market. As you will see below, its clear that the fair value of ENGlobal's operations is not by any means accurately reflected by its current price in the market.
ENG Chart
ENG data by YCharts
In early 2011, ENGlobal's stock price took a nasty turn. At the time, its share price was right above $5, and now, ENGlobal trades at barely above $1 per share. In just a two-year period, its stock price managed to decline by 80%. But, the question is - why?
Earlier this year, management announced the discontinuation of one of its business segments - Field Solutions. The revenue generated from this segment was comparable to the revenue generated by the Automation segment. However, the Field Solutions segment was not growing. It was simply producing a negative operating profit and has been doing increasingly worse over the course of the last few years. While the discontinuation of this business segment had relatively little impact in the short-run, the capital that would have been used to sustain this business segment can now be utilized appropriately - to fund expansion.
Yes, ENGlobal's operations have expanded overtime. However, issues concerning capital adequacy and low levels of solvency have ultimately served as a deterrent preventing ENGlobal from developing any form of sustainability in regards to its operations. Low levels of capital available to fund projects has forced work to pile up, which overall has increased ENGlobal's aggregate amount of backlogged work. The discontinuation of its Field Solutions segment will fulfill ENGlobal's liquidity needs for reducing its backlogged work and improve its solvency position in the long-run.
Operating Performance Has Been Mediocre, But Is Already Showing Signs of Improvement
In addition to net income, it's crucial to look at the amount of cash generated from operations. By looking at operating cash flow we can determine whether a company is generating real earnings and eliminate the potential usage of accounting gimmicks that distort net income. But as you will see below, ENGlobal's performance in the last couple of years is nothing to get excited about. In fact, looking at its operating cash flow may seem almost useless given the unfavorable loss in net income for both years, 2011 and 2012. But shortly, you will see how this has already begin to change in 2013.
First, let's take a look at a portion of its cash flow statement for the past two fiscal years:
(click to enlarge)
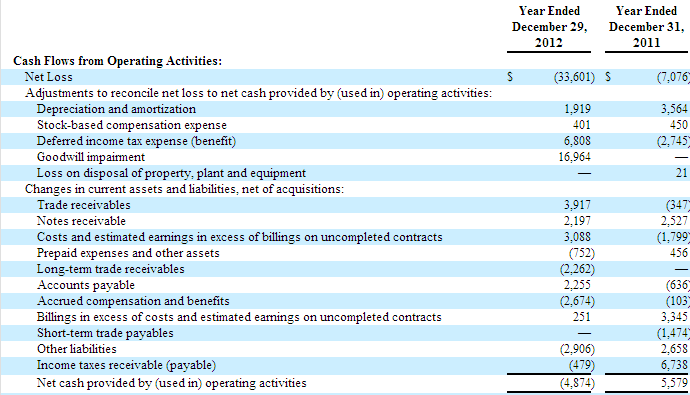
Clearly, ENGlobal's earnings did not improve from 2011 to 2012. Its level of operating cash flow went from positive to negative after reporting a loss on net income of nearly 5x more than the loss in the previous year. Furthermore, its operating cash flow for 2011 was barely positive. If you look closely at the cash inflow items for 2011, you will see the income taxes received for this year ($6.738 mm) made all the difference. The sole reason ENGlobal had positive operating cash flow of $5.579 mm in 2011 was because of the income tax receivables. Unfortunately, its historical earnings do not reveal the stability investors like to see, but it does provide some support for why ENGlobal was heavily sold off the way it was. Going forward, investors should expect to see major changes.
So far in 2013, we have seen the structural changes management made by eliminating one of its business segments. However we have yet to see the full economic value this decision has the potential to add. Besides the depletion of an entire business segment, the changes related to the costs associated with sustaining that segment are going to have the greatest influence. And ENGlobal's Q1 2013 financials are just beginning to show this. For Q1 2013, ENGlobal reported operating revenue of $49.763 mm. Its net income came out to $1.937 mm, which is the equivalent of $0.07 earnings per share based on the weighted average number of shares outstanding. Its important to note that the final net income figure reflects the loss from continuing operations and income from discontinuing operations, which as previously mentioned, the Field Solutions business segment. At the share level, the income from discontinued operations was $0.11 and the loss from continuing operations was $0.04, which combined equates to net earnings per share of $0.07. This is a significant improvement from the previous quarter as well as this same quarter the previous year. In addition, the improvement is revealed through its operating cash flow.
For Q1 2013, its operating cash flow came in at $5.89 mm. As you will see in the graph below, this is a dramatic change from the previous quarter where its operating cash flow was negative at $4.874 mm. The significant variation between these two figures can be attributed to the discontinuation of one of its business segments as mentioned earlier. Going forward, I expect ENGlobal to gain stability in its operating cash flow and sustain a positive level.
ENG Cash from Operations Annual Chart
Other notable changes made in this quarter concern capital expenditures and changes in working capital. Capital expenditures saw a major decrease from roughly $670,000 to $20,000. On the other hand, working capital increased quite a bit to $6.34 mm from $2.63 mm.
Shareholder Base
ENGlobal's 27.4 mm common shares are primarily split between insiders and institutional investors. Nearly 44% are held by insiders while institutional investors account for about 28%. The remaining portion of its common shares are disbursed among private investors with a majority of them residing in the United States.
The Stock Is Dirt Cheap...
Valuing a company in either its early growth stages or rather small in terms of the magnitude of its earnings can be rather difficult. Additionally, it's important for investors to understand the absence of stable free cash flows can cause the inputs in present value models to produce variation within the results. Therefore, I am going to stay on the conservative side in regards to the inputs I use.
Below, you will see that I used the corporation valuation model to arrive at an intrinsic share price estimate for the end of 2013. Although this model does not incorporate free cash flow estimates extending beyond one year, I feel it provides greater accuracy given ENGlobal lacks a strong history of generating free cash flows. Let's take a look:
As a result, this model concluded with an intrinsic share value of $2.56, which suggests an upside of nearly 115% from its current price in the market. Note this model takes into account ENGlobal's current capital structure, which is reflected through its weighted average cost of capital (WACC) of 10.5%. In addition, I assumed its operations will grow at 6.5% over the next year.
Investor Concerns
As previously mentioned, for a small capitalization ENG presents relatively low business risk. In addition, the quantitative risk within its holding period returns is relatively low as well. Using its historical monthly holding period returns, I computed a firm-specific beta of only 1.83. But like any investment, we have to assume the worst and account for the probability of extreme outcomes. To ensure investors are ready to protect themselves in a timely manner from unforeseen events, there are several things investors need to bear in mind.
First, it's important investors understand that there is a moderate level of uncertainty surrounding future revenue and earnings. The extent to which this uncertainly will actually translate into a material impact on ENGlobal's operating performance heavily depends on the state of its backlogged work. As of December 29, 2012, ENGlobal's backlogged work was approximately $205.3 mm. Since December, the total amount of backlogged work has been reduced, however it's not certain that the remaining portion of revenue projected in backlogged work will be realized or not. In addition, ENGlobal's dependence on a few select customers has the potential to negatively impact its performance down the road. Last year, ENGlobal heavily relied on three customers including Caspan Pipe Consortium, the US Government and BASF Corporation. These three customers comprised 9%, 7% and 5% of its revenue, respectively. The loss of business from any of these customers could have an adverse impact on total revenue in the future.
Bottom Line
As you can see, ENGlobal is in a recovering state. Its operating margins reflect low levels of profitability and its cash flows are just starting to gain stability. The discontinuation of its Field Solutions segment enhanced its performance in Q1 of 2013 in terms of its net earnings, but its operating income on a standalone basis tells us ENGlobal has not recovered. The increases in its operating income will depend on management's ability to complete backlogged work and effectively maintain the level of outstanding work to a minimum. Liquidity has been a major issue in the past, but recent enhancements in this area eliminate this concern. As a result of the discontinuation of ENGlobal's Field Solutions segment, its level of solvency improved dramatically. The increased level of solvency will not only help reduce backlogged work, but more importantly, allow ENGlobal to sustain its operations in the long-run.
ENGlobal's performance will also rely on management's ability to effectively implement a new cost structure. While ENGlobal is not highly leveraged in terms of the fixed costs used to sustain its operations, maintaining an effective capital budget that monitors cash outflows to investing activities will be crucial. And since a portion of its contracts use a fixed pricing structure, being able to minimize capital expenditures will certainly help strengthen margins and tighten down on operating expenses.
Overall, ENGlobal presents an intriguing investment opportunity. The aggregate risk involved is moderate at best, and yet, the reward potential is substantial. ENGlobal should be viewed as a speculative buy with an abnormal amount of downside risk protection from its suppressed valuation. The probability of achieving an abnormal return on an initial investment is high. Therefore, I recommend buying ENGlobal at its current valuation.
Sources: TD Ameritrade, Google Finance, Yahoo Finance, Morningstar, FinViz, YCharts, sec.gov, and ENGlobal's Company Website.

7 Reasons To Buy Domtar Corporation

Domtar Corporation (UFS) is a manufacturer, marketer, and distributor for a wide selection of fiber based products, including communication papers, packaging, and other specialty papers. Currently, there is a strong demand for pulp and paper products across the globe. And with only several firms serving the end consumers of the industry, the level of competition remains minimal. Domtar's sizable position in the industry's oligopoly market structure will enable it to maximize profits that are sustainable in the long-run. Additionally, this will augment Domtar's overall firm value as well as the intrinsic value of its common equity held by shareholders. This article will outline Domtar's business model, provide seven reasons why Domtar's a strong buy at its current valuation, and conclude with several investor concerns.
Domtar's Market Valuation Is Shrinking, But For No Reason
A notable decline in Domtar's security price in the market has recently made it an even more attractive value play. Earlier this year, Domtar was trading right above $80 per share. Looking at the graph below, you will see Domtar's security price declined by nearly 23% over the last six months.
Figure 1: Domtar's YTD Price Graph
UFS Chart
UFS data by YCharts
Despite the decline in its price, Domtar remains a highly profitable company. Domtar's total revenue for Q1 2013 came in at $1.345 bn. After costs and expenses, this translated into net earnings of $45 mm ($1.29 EPS), which is significantly higher than net earnings in Q4 2012 and Q1 2012. Net earnings in Q4 2012 and Q1 2012 were $19 mm ($0.54 EPS) and $28 mm ($0.76 EPS), respectively. Overall, profitability has improved on a quarter over quarter and year over year basis. Arguably, there are substantial reasons for the recent decreases in Domtar's market value and it's clear that Domtar is trading at a severe discount to its fair value.
The Business
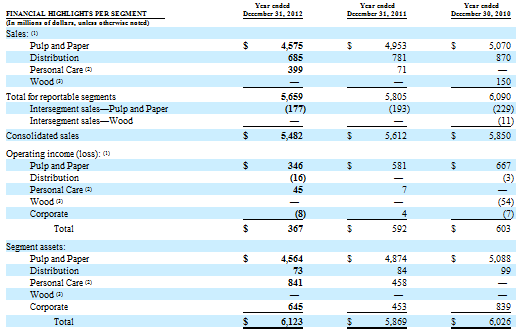
Domtar operates in three business segments including Pulp and Paper, Distribution, and Personal Care. The Pulp and Paper segment is by far Domtar's largest segment. On an annual basis, this segment alone produces nearly 4.2 metric tons of hardwood, softwood, and fluff paper. The vast majority of the pulp manufactured at these plants is distributed internationally to consumers who wish to manufacturer paper and other consumer products. In FY 2012, Domtar's revenue came in at $5.5 billion and the revenue from this segment alone was $4.4 billion, which equates to roughly 80%.
Figure 2: Domtar's Revenue Streams
(click to enlarge)
In terms of manufacturing, Domtar owns and operates ten pulp and paper mills with an annual paper production capacity of approximately 3.4 million tons of uncoated free-sheet paper. Eight of the ten mills are located in the US and the remaining two are in Canada. Approximately 81% of its paper production capacity is in the US and 19% is in Canada. Domtar's paper manufacturing operations are sustained through 15 converting and distribution operations including a network of 12 plants that are located off-site of its paper manufacturing operations. In order to satisfy the demand of the end consumers in the market, Domtar produces market pulp in excess of its internal requirements at its three non-integrated pulp mills in Kamloops, Dryden, and Plymouth. On average, Domtar sells approximately 1.6 million metric tons of pulp per year. The estimate is subject to vary due to the market conditions.
The second part of Domtar's business is its distribution segment, which involves the purchasing, warehousing, sale and distribution of its various products and those of other manufacturers. These products include business, printing as well as publishing papers, and certain packaging products. These products are sold to a well diversified customer base, which includes small, medium and large commercial printers, publishers, quick copy firms, catalog/retail companies and institutional entities. Domtar's distribution segment operates in the United States and Canada under a single banner and umbrella name, Ariva. Ariva operates throughout the Northeast, Mid-Atlantic and Midwest areas from 16 locations in the United States, including 12 distribution centers serving customers across North America. The Canadian business operates in two locations in Ontario, two locations in Quebec, and two locations in Atlantic Canada.
Last, is Domtar's personal care segment. This segment is responsible for the manufacture and sale of adult incontinence products and disposable washcloths marketed primarily under the Attends brand name. Domtar obtained the right to market its products under the Attends brand name in 2012 when Domtar acquired Attends Europe. At the time of the acquisition, Attends Europe was a manufacturer and supplier of adult incontinence care products in Northern Europe. As a result of the acquisition, Domtar is one of the leading suppliers of adult incontinence products sold into North America and Northern Europe.
Seven Reasons Domtar's A Solid Buy Under $66 Per Share
#1 The unique attributes of the industry's oligopoly market structure will be a lucrative resource for helping Domtar remain a dominant player in the industry. On May 21st, 2013 Domtar presented at the Goldman Sachs Basic Materials conference in New York as the largest integrated marketer and manufacturer of fiber based paper products in North America. As mentioned earlier, Domtar competes in an industry with few competitors, which is one of the main characteristics of an oligopoly. In addition, other characteristics include high barriers to entry and product differentiation, which both exist as a feasible means for providing a high degree of specialization to meet consumers needs. However, the most lucrative attribute that will effectively benefit Domtar in the long-run is the leverage over pricing power oligopoly's provide. Given there are few competitors in the market and a low probability of any new firm succeeding in the market, Domtar has the ability to exert a large degree of pricing power in the market place. The consistent demand exhibited by end consumers for Domtar's specialty fiber products is inelastic and the majority of the consumers are companies that rely on these products for production. Therefore, Domtar has the capability of raising its prices to a certain degree and will still be capable of retaining its customer base. The ability utilize pricing power as such is rare and something that many firms will never have at their disposal. In the long-run, being able to leverage further control over prices can heavily influence margins and profits for the good of the firm.
#2 Domtar's operating performance has a history of success, and more importantly -- stability. In the last ten years, Domtar's revenue has experienced quite an increase -- nearly 42% over the entire period. After 2008, its level of revenue has maintained relatively the same at an average of $5.5 bn per year. However, the story is not the same for its operating and free cash flow. Domtar's cash flow generated from operating activities has remained relatively the same over the past ten years. Even following the large revenue increase in 2007, operating cash flow exhibited little change. This can be attributed to substantial cash outflows for operating activities. With such a high level of revenue, there is no reason why Domtar cannot sustain a higher level of operating cash flows. Going forward, I anticipate cash outflows to decrease, which will help drive operating cash flows up. Overall, Domtar's displays excellent stability in its revenue. And based on its operating results in Q1 2013, Domtar will have no issue exceeding 2012's level of revenue and net earnings.
Figure 3: Domtar's Operating Performance
UFS Revenue TTM Chart
#3 Investors are on track to benefit from a structural change to Domtar's variable operating costs. As you may have noticed in the graph above, there has been a sizable difference in the past between Domtar's cash flow generated from operating activities and its free cash flow available to the firm. The sizable difference can be attributed to a high level of input costs that are accounted for as capital expenditures. As noted in Domtar's Q1 2013 earnings report, management believes there will be a change in Domtar's variable costs next quarter:
"We expect continued momentum in pulp markets with moderate improvement in pricing and steady shipments. In papers, our volumes are expected to stay relatively similar to the first quarter in the near term. The second quarter will be affected by the usual seasonal higher maintenance activity in pulp, while input costs are expected to decline slightly, notably due to lower usage of energy."
A decrease in input costs will reduce the aggregate amount of capital expenditures, which will increase free cash flow as a result. Ultimately, we want to see free cash flow grow, but we also want the variation between operating and free cash flow shrink. And it appears the difference will shrink according to managements expectations for the rest of this fiscal year.
#4 Domtar's capital structure is adequate for its operations and its high level of solvency is perfect for sustaining growth in the long-run. Additionally, Domtar is not highly leveraged in terms of debt. Its current debt-to-equity ratio is only 0.40, which is significantly lower than its peers. As previously mentioned, Domtar is making slight changes to its cost structure. Although its current cost structure does not entail a high degree of financial and operating leverage, reducing input costs will help further reduce this risk. Let's take a look at Domtar's financial leverage:
UFS Financial Leverage Chart
Financial leverage is an excellent measure that helps depict a firm's level of solvency. The degree of financial leverage tells us to what extent a firm uses fixed costs in its cost structure. As you will see above, Domtar's current financial leverage is significantly low, which is positive from an investment standpoint. In addition, I expect this number to decrease as the firm makes adjustment to its input costs.
#5 Domtar's valuation is attractive. The combination of basic metrics and other valuation multiples indicate Domtar is trading at a discount to its fair value. Below, you will notice Domtar average P/E ratio has been increased within the last two years. I expect this trend to continue and can easily see Domtar commanding a P/E of right around 15x, which is ideally where I would like to see it trade. Also, you will see that Domtar's P/B and P/S are extremely low and have displayed relatively little change over time.
Figure 4: Domtar's Basic Valuation Metrics
UFS PE Ratio TTM Chart
In addition, Domtar's level of free cash flow available to the firm and the growth rate of its earnings show Domtar's security price is clearly undervalued. Let's take a look:
Figure 5: Domtar's FCF TTM & PEG Ratio
UFS Free Cash Flow TTM Chart
Currently, its free cash flow TTM is right around $321 mm. With 34.80 mm shares outstanding, its free cash flow per share equates to $9.22. Given its trading around $67 in the market, it price-to-free cash flow (P/FCF) ratio is approximately 7.26x. In addition, you will notice above that its price-to-earnings growth ratio is less than 1. The combination of a P/FCF ratio of less than 15x and a PEG ratio of less than 1 is a strong indication that the security is undervalued. And based on both of these ratios, we can conclude that Domtar is indeed undervalued.
#6 Domtar's relative strength index (RSI) indicator is suggesting there is a favorable probability that we will soon see a turnaround in its security price. After being heavily oversold this year, its current 30-day RSI indication is right around 29.75. An RSI between 20 and 30 indicates the security has been heavily oversold and that there is a high probability of an upward trend in its security price.
#7 Fifteen analysts that cover the stock have a median and mean price target of $86 and $83.67, respectively. The mean price target suggest an upside of nearly 26% from its current market value.
Bottom Line
Domtar's lucrative position in a niche market is perfect for increasing margins and sustaining long-run profits. Domtar's valuation is highly attractive and it is now a perfect time to initiate a position. However, before doing so, there are a couple things investors need to be aware of. As we saw, UFS is heavily dependent on its revenue from the Pulp and Paper segment of its business. Domtar has several revenue streams, however the fact its revenue is derived predominantly from one source is something that could negatively impact its performance down the road. At the moment, the demand for its products in the pulp and paper segment is consistent, and historically, it has been this was as well. Going forward, the probability of the end consumers maintaining a stead demand is high. However, there is always the possibility for this demand to diminish, and investors need to take this into account. Additionally, investors need to keep a close watch on Domtar's international business. There is a strong international demand for the material produced from Domtar's operations and a large portion of its end consumers are international companies. Although the market structure of the industry makes it highly difficult for a new firm to enter the market, the possibility of a foreign competitor entering the market to supply a differentiated set of goods is a possibility. Therefore, it is important that Domtar is consistently changing whatever is necessary to fulfill its customer needs. Investors can monitor this by analyzing sales growth on a quarterly basis. Overall, Domtar is an excellent company on sale for a bargain. Given its favorable valuation, its sizable position in the industry, and its potential to sustain profits in the long-run, I recommend investors buy Domtar at its current valuation.

Sunday, February 3, 2013

Alcoa's Short-Term Price Volatility Is Irrelevant; It's Time To Look At Future Growth

http://seekingalpha.com/article/1130171-alcoa-s-short-term-price-volatility-is-irrelevant-it-s-time-to-look-at-future-growth

Energy Services Of America: A Beaten Down Company To Watch


Energy Services of America (ESOA.OB) is a beaten down company operating in the equipment and services industry for natural gas and through potential growth prospects presents a speculative buying opportunity that has the potential to provide shareholders with abnormal terms. Negative sediment surrounding ESOA is prevalent given the historical business risk associated with its operations, however after being transferred to the pink sheets where it now trades under a different ticker, volume recently dropped to an all time low as the security's market value per share did the same. The average volume traded per day remains stagnant, but it is progressively beginning to increase. This article begins with a broad overview to ESOA's business model and focuses heavily on its operations providing investors with the keen details needed to understand what is essential for ESOA to continue growing as a firm. In addition, this article will outline ESOA's capital structure breaking down its sources of debt as well as the condition and ownership of its common equity outstanding. To conclude, investors will be provided with several forward looking valuation metrics as well as qualitative and quantitative firm specific risk factors investors need to take into account.
Overview
ESA provides contracting services for energy related companies. Its services include installation, replacement and repairs of pipelines for the oil and natural gas industries, general electrical services for both power companies and various other industrial applications, installation of water and sewer lines for various governmental agencies, and various other ancillary services. In addition, ESOA also provides services for liquid pipeline construction, pump station construction, production facility construction, and other services related to pipeline construction. ESOA currently has 602 employees serving customers that are primarily located in the Mid-Atlantic region in states such as West Virginia, Virginia, Ohio, Pennsylvania, Kentucky, and North Carolina. Note these are the most common areas in which ESOA operates and that it does operate nationwide. Here is a specific list outlining a few of ESOA's customers:
  • Spectra Energy
  • Dominion Resources
  • Columbia Gas Transmission
  • Columbia Gas of Ohio and Pennsylvania
  • Nisource
  • Marathon Ashland Petroleum LLC
  • American Electric Power
  • Toyota
  • Hitachi
  • Kentucky American Water
  • Equitable Resources
  • Markwest Energy
  • Range Resource
It is important to note that due to the seasonal impacts on ESOA's operations activities such as laying pipeline often does not occur during winter months, therefore not all of the customers listed above can be classified as year-around customers. In order to provide services to its customers, ESOA operates through its wholly owned subsidiaries including:
  1. S.T. Pipeline, Inc.
  2. C.J. Hughes Construction Company, Inc.
  3. Nitro Electric Company
For additional information pertaining to ESOA and its subsidiaries please visit ESOA's company website or click on the link above corresponding to the individuals subsidiary of interest.
Relative Performance & Competitive Environment
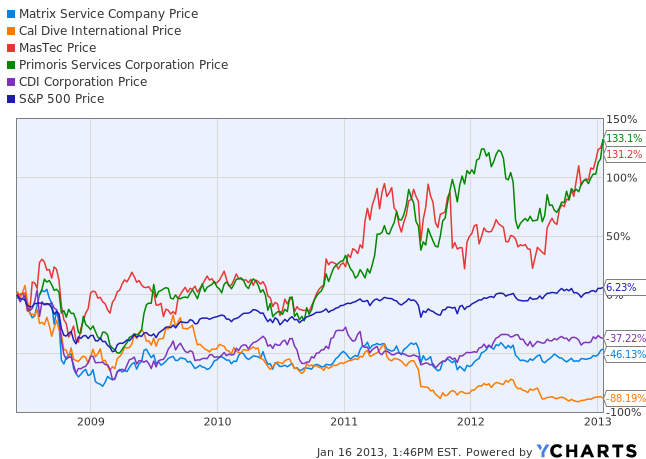
As you will see below in figure 1, following the credit crisis in 2008/2009 ESOA's market value per share fell dramatically and has remain relatively stagnant since. ESOA is currently trading at the bottom of its valuation and in terms of a value play by definition it would be a buy, however substantial debt outstanding and low levels of profitability merely make this stock one to watch in the short-term.
Figure 1: ESOA's Relative to S&P 500
(click to enlarge)
To illustrate the performance of ESOA's peers relative to the S&P 500 over the past five years, I used YChart's custom graphs. The companies used in this peer analysis include Matrix Service Company (MTRX), Cal Dive International (DVR), MasTec(MTZ), Primori Services Corporation (PRIM), and CDI Corporation (CDI).
Figure 2: ESOA's Peers Relative Performance
(click to enlarge)
As I have illustrated, you will clearly see that ESOA operates in an industry that is highly competitive in nature. The companies I have outlined in figure 2 above are only a few of ESOA's peers. The high level of competition derives from optimal financing strategies that require high maintenance costs and abnormally high levels of capital adequacy to fund operations. In addition contracts for pipeline are typically awarded through a competitive bid process.
Backlogged Work Still Exists, But Improvements Are Underway
By analyzing ESOA's 10-K for the end of FY 2012, it is clear the substantial amount of backlogged work can be attributed to the negative decline in ESOA's profitability and significant downfall in market value over the course of the past year. According to ESOA's 10-K, as of September of FY 2012 there was approximately $57.4 million dollars in work to be completed on existing contracts outstanding, which is comparably less than the $128.5 million in backlogged work for the previous year at this date. Note ESOA's backlogged work represents contracts for services that have been entered, but have yet to be commenced. One reason for this is mentioned by ESOA's management:
"Due to the timing of ESOA's construction contracts and the long-term nature of some of our projects, portions of our backlog may not be completed in the current fiscal year."
The primary reason for this has to do with the ESOA's average duration in terms of how long it takes to complete a project from time the contract is initiated to the time it is ended. The majority of ESOA's projects can be completed in a relatively short period of time with a project lifespan ranging from two to five months. Larger scales projects can take upwards to 18 months to be completed. One of the key issues ESOA's encountered over the past year was unforeseen weather condition, which ultimately served as a barrier delaying the completion of existing and start of new contracts.
Capital Structure
Another area of concern that has significant implications on ESOA's ability to complete projects is its capital adequacy, basically the working capital available to fund projects. Its primary source of debt derives from its $18 million line of credit with a regional bank and under a Forbearance Agreement ESOA has agreed to a 6.5% interest rate on the principal outstanding during this period. The Forbearance Agreement between ESOA and its lenders was established and made effective on November 28, 2012. The primary disadvantage of this agreement is it prevents ESOA from making additional draws on its revolving line of credit. In addition, as stated in ESOA's 10-K the major covenants governing this line of credit are:
  1. Its current ratio cannot fall below 1.5.
  2. Debt to tangible net worth must not exceed 3.5.
  3. Capital expenditures must not exceed $7.5 million per year.
  4. Dividends shall not exceed 50% of taxable income without prior bank approval.
This Forbearance Agreement may be terminated upon certain evens and in any case on May 31, 2013. The termination of a contract as such would have a dramatic effect of ESOA's ability to complete projects. Primarily, it would restrict its working capital available to allot to unfinished projects. ESOA has the potential to receive a separate forbearance line of credit, if it were to apply and be accepted, however taking into account ESOA's current level of profitability and capital structure this not highly plausible.
An additional concern I have underlying the Forbearance Agreement is in regards to its subsidiary S.T. Pipeline and is clearly written in its 10-K:
"The Forbearance Agreement, among other things, requires that we close our S T Pipeline subsidiary and dispose of its assets."
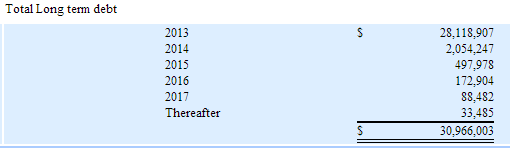
For an easy reference, here is ESOA's long-term debt outstanding listed in order of maturity.
Figure 3: ESOA's LT-Debt Maturities
(click to enlarge)
Off-Balance Sheet Risk
In terms of off-balance sheet items investors need to be aware of ESOA's practice of lease financing and its concentration of credit risk that derives from customer transactions. In practice, it common for firms to exclude short-term financing for items such as leases from the balance sheet, however ESOA excludes several long-term items as well.
ESOA has various leases that are not capitalized and therefore are not reported on its balance sheet. These leases are specifically to help ESOA obtain equipment, vehicles, and facilities that are depreciable in nature and serve little benefit if purchased for long-term use. ESOA first lease obligation consists of two pieces of real-estate under-long term agreements extending through August 15, 2014, which require monthly rental payments of $5,000. ESOA's second lease agreement is for its headquarters office and requires monthly payments of $7,500 with an option to renew expiring October 2013. ESOA's last lease agreement is for its office and shop space requiring monthly payments amount to $11,800.
ESOA's level of internal credit risk revolves around and in entirely dependent upon the credit extended to customers. These lines of credit are extended to customers under normal payment terms, however it is typically unsecured credit meaning its extended without any form of collateral to back it up.
Valuation
ESOA is highly leveraged in terms of its debt financing and unfortunately is highly associated with the significant decline in its security market price as has been clearly priced in. ESOA's current market capitalization is roughly $7.95 million, which is slightly more than the book value of its stockholders' equity on its balance sheet for the period ended September 30, 2012. Highlighted below in figure 4, you will see total assets were $59,755,749 and total liabilities $53,314,384. The difference between the two equates to only $6,441,365. In contrast to previous years you will see the difference between its assets and liabilities was significantly greater. This can be attribute to the $36,914,021 in "Goodwill" that was no longer deemed to have any relevance. According to ESOA's 10-K, "Based on our continued operating losses and management's forecasts of future cash flows our goodwill impairment test indicated that the goodwill of the Company had no value."
Figure 4: ESOA's Balance Sheet Value
Firm Specific Risks: Quantitative & Qualitative
Despite ESOA's significant decline in its market value per share, historical patterns of volatility are relatively low. ESOA reveals a firm-specific beta value on only 1.27, which is slightly above the market beta level of 1.0. To analyze ESOA's firm-specific risk, I used its holding period returns with distributions for approximately the past six years (2006-Present) in order to compute the sample estimates above in both normal and logarithmic form. For accuracy and effort towards eliminating error in computing the sample estimates, I used the same methods in all calculation and retrieved equivalent data with identical number of observations.
Figure 5: ESOA's Risk Metrics
In figure 5, notice the variation between ESOA's sample estimates for the HPR (normal) and HPR (logarithmetic). The deviation between theartihmetic average for both computations is quite significant. ESOA's normal arithmetic average return for this period was 10.98% where as the logarithmic return was 3.60%. Note "Arithmetic Average" was computes using weekly data and therefore has been adjusted to represent the annualized return for both HPR normal and logarithmic. Also note the logarithmic HPR was first computed by deriving the relative return for each individual HPR, which is simply (HPR+1). This ensures all values are positive prior to computing the logarithmic value of each number. The standard deviation, simply the fluctuation in percentage terms of the securities market price per share on a time noted basis, is high at 6.73%. This is high in contrast to an average market index fund, which would be approximately 1.5% over the same period, however taking into account the industry in which ESOA operates this is merely a small area of concern. Engaged in an environment where a competitive bid process is used regularly to gain customers for contracts indirectly will augment this value. The kurtosis value revealed in ESOA's holding period returns does not surprise me given its historical trend, however it is an area of concern. Kurtosis is useful in determining the degree of peak in a distribution to help determine the likely hood of extreme outcomes. To some this simple computation may appear to be an obscure measure with little importance, however it was the failure to analyze metrics as such that results in failing to recognize the extreme probability of an even such as the 2008/2009 credit crisis from occurring.
In addition to the quantitative risk metrics involved with ESOA, there are firm-specific qualitative risk factors that need to be assessed as well. As I previously mentioned, I addressed concerns regarding ESOA's backlogged work, issues resulting from an inadequate capital structure, and several off-balance sheet items, but the core firm-specific risk facing ESOA is its working capital available. Excluding adverse weather conditions, the other primary factor affecting ESOA's operations its capital available to complete projects and this is clear through its history of backlogged work. Going into FY 2013, it will be imperative ESOA seeks alternative methods of financing in order to be capable of sustaining operations.
Conclusion
ESOA is a company if given the appropriate changes to its capital structure and financing decisions has the ability to make a turn around in the industry. Capital adequacy for funding projects and complications surrounding debt financing are the key underlying issues that initiated a sell off by market participants with high uncertainty. In conclusion, ESOA is a speculative investment that needs critical attention as it has the potential to provide investors with magnified gains, however substantial down side risk is prevalent with any firm that is not turning over a profit.
Sources: TD Ameritrade, YCharts, Google Finance, Yahoo Finance, and The US Securities and Exchange Commission Website.

Appealing Valuation Derived From CSX's Growth Potential

http://seekingalpha.com/article/1128041-appealing-valuation-derived-from-csx-s-growth-potential

4 Reasons To Buy Zixi Corp At $3 Per Share

http://seekingalpha.com/article/1103701-4-reasons-to-buy-zix-corp-at-3-a-share

Cooper Tires: A Quick Glance At Two Bonds

http://seekingalpha.com/article/1098931-cooper-tires-a-quick-glance-at-2-bonds

Modeling The Value Of Cooper Tires

http://seekingalpha.com/article/1096821-modeling-the-value-of-cooper-tire

Modeling The Value Of Cooper Tires

http://seekingalpha.com/article/1096821-modeling-the-value-of-cooper-tire

Modeling The Value Of Cooper Tires

http://seekingalpha.com/article/1096821-modeling-the-value-of-cooper-tire

A Bullish Case For Investing In Global Energy

http://seekingalpha.com/article/1092321-a-bullish-case-for-investing-in-global-energy

Canadian National Railway: A Definitive Value Play

http://seekingalpha.com/article/1092281-canadian-national-railway-a-definitive-value-play

7 Reasons To Buy This $7 Financial Stock

Banco Santander Brazil (BSBR) exists to serve its customers with financial products and services highly similar in nature to the major money center banks in the US. Due to the unique structure of Brazil's banking system BSBR has a competitive edge that would be nonexistent for a bank of its size in the US. In Brazil, six banks comprise nearly the entire banking industry controlling over approximately 90% of the assets throughout the entire system. BSBR is one of these six banks and through its strong levels of profitability and keen location in a demographic-rich area that is in need of financial services offers a highly feasible investment opportunity. This article provides an overview to BSBR's business model, highlights its asset composition as well as recent performance, and then concludes with seven reasons why BSBR is a strong buy at its current market value. Continue reading @...http://seekingalpha.com/article/1086611-7-reasons-to-buy-this-7-financial-stock