For quite some time, I have been an avid follower of Flexible Solutions International (FSI). I last wrote about FSI in October of 2012, and since, its volume and share price remained relatively stagnant with the exception of recent trading activity. Following October of 2012, FSI's stock price bottomed out forming a double bottom support line at $0.80 per share. Despite the negative sediment of pure uncertainty that forced this decline, an optimistic outlook surrounding FSI's operating performance was quick to be priced in. And after the release of solid operating results for Q2 2013, strong buying activity forced its share price out of the slums. In order for FSI to be sustainable in the long-run, there's no question its revenue will need to improve. The unique attributes of FSI's products and the niche target market it serves has always intrigued my interest, but my main concern still remains its market potential. While its products fit the suitability of a wide range of consumers, the aggregate amount of revenue its operations generate on an annual basis needs improvement. For FY 2012, FSI's total revenue came out to $16.40 mm, which was lower than expected. Going forward, analysts have reaffirmed guidance for FY 2013 increasing revenue estimates to $17.43 mm, however even if analysts are fairly accurate this is only an increase of about 6% on a YoY basis. And while this is favorable, this level of growth will either need to continue or at a minimum sustain while management reduces its overall operating costs. Conclusively, FSI is a small company with large potential as it has yet to peak in its growth stage. Its operations are profitable and its common shares offer pretty solid value at current market value. Active investors have the potential to captivate on a potential upside in excess of 100%. For starters, here's an overview of its business model.
Company Background
FSI was founded on January 26, 1991 as British Columbia corporation. Roughly seven years later, in 1998, Flexible Solutions International, Ltd. merged with Flexible Solutions International, Inc. As a result, FSI issued seven million shares of common stock to former shareholders of Flexible Solutions International, Ltd in exchange for all of their outstanding shares. Today, FSI operates under a handful of subsidiaries, and while operating through multiple subsidiaries does not heavily influence the core fundamentals of its business, it does however impact the method in which its financial statements are reported, which you will see later on.
Generally speaking, FSI's products are all designed with a similar intent -- conservation. Its products tend to be categorized based on their functionality, but for simplicity, its products can be divided into two categories, including Energy and Water Conservation Products (EWCP) and TPAs. In terms of revenue, its TPAs dominate more than their fair share accounting for the vast majority of the revenue generated by its operations in the United States as well as Canada. In 2012, nearly 95% of its revenue derived from TPAs, and 2011 reveals a break down that's relatively similar. Although EWCPs only make up a small portion of FSI's total revenue, this segment of its revenue is well overdue for growth and provides the largest opportune for expansion. With that being said, let's start with an overview of its products within this segment.
As for EWCPs, FSI manufacturers, markets, and sells these products under several branded names, including HeatSavr™, EcoSavr™ and WaterSavr™. Each brand typically caters to a different target market, however all of its products are highly similar in nature. HeatSavr™ is one of FSI's solutions that is designed to reduce heat loss and evaporation from the surface of the pool that's exposed. Basically, this product is a "liquid solar pool cover" comprised of biodegradable ingredients that create a barrier to slow the heat and water loss that ultimately causes high pool room humidity as well as high heating bills. Below is an image retrieved from FSI's company website showing a before and after image of HeatSavr™ applied to a pool's surface.
(click to enlarge)

Evaporation is one of the primary forms of heat loss from swimming pools and spas, and FSI's HeatSavr™ has been proven to slow evaporation. According to management, tests have proven the heat bill savings can range from as low as 15.5% at a high use 50 meter municipal pool, to as high as 40% at a low use condominium pool. The results will vary from region to region, however HeatSavr™ is guaranteed to save energy in every pool. Overall, the capability for this product to effectively reduce the rate at which water evaporates translates into substantial cost savings. FSI's HeatSavr™ is a cost effective solution that is used at both the private and commercial level. For individuals, FSI's designed EcoSavr™, which is simply a more convenient way for individuals to apply HeatSavr™ to their pool. In addition to being user friendly, EcoSavr™ is also a cheaper alternative that is quite popular among owners of privately owned pools. For further information on EcoSavr, visit Liquid Pool Covers.
In addition to HeatSavr™, WaterSavr™ is another one of FSI's products that is very similar both in terms of its end goal of conserving and its chemical composition. WaterSavr™ contains the same active ingredients that are in HeatSavr™, however the ingredients are in an alternate form that is harmless to the environment and will not contaminate drinking water. In contrast to HeatSavr™, WaterSavr is designed for much larger bodies of water and has been proven to decrease water evaporation by substantially more. According to a recent study:
"Only 2.5% of the earth's water is freshwater, and of that, less than 1% is available as surface water."
(click to enlarge)
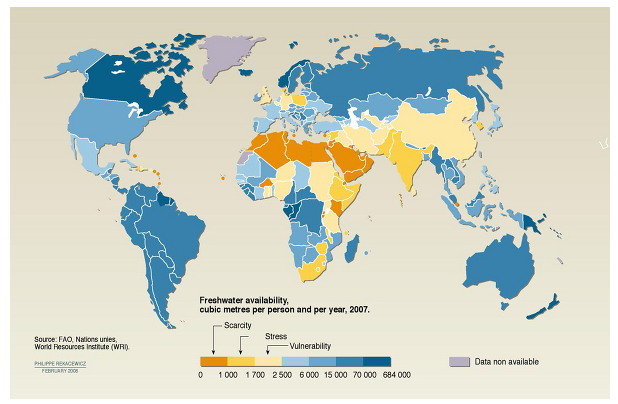
Although many individuals across the globe do not see water scarcity as a major issue at the moment, it will become increasingly more important over the next twenty years. FSI's product WaterSavr™ is designed for large bodies of water, which are also the same bodies of water that serve as the primary source of drinking water for surrounding communities. WaterSavr has been proven to effectively reduce water surface evaporation by as much as 50% in a number of different applications, including reservoirs, aqueducts, canals, stock watering ponds, flood water crops, portable water storages, and various agricultural irrigation systems. Additionally, the chemicals in WaterSavr™ have been altered from HeatSavr™. Therefore, WaterSavr™ remains an effective solution for reducing water evaporation that is not only eco-friendly, but cost effective for end consumers.
As mentioned earlier, the other portion, or I should say larger half of its business revolves around the manufacturer and sale of Thermal Polyaspartic Acids, which are also know as TPAs. This segment of FSI's business operates and is managed through its wholly owned subsidiary NanoChem Solutions. FSI's final products are manufactured by NanoChem Solutions and consists of an aspartic acid made in Taber as well as the other aspartic acid FSI purchases from its overseas supplier.
The overall demand for TPAs covers a wide landscape and is continuing to grow. One of the primary uses for TPAs is in agriculture. TPAs are designed to limit crystal embryo growth between positive and negative fertilizer ions in the soil. Therefore, when the embryonic crystals are prevented from transforming into a fully crystalline form by TPA, the fertilizer then remains available at a low energy cost. Basically, its a solution with the capability of enhancing FSI's profitability, while providing customers with a cost effective solution that will substantially reduce energy costs as well as agricultural yields. For instance, treating one acre of land will cost about $20 or less, however, the potential savings for the customer may be in excess of $50 in energy costs along with a larger production yield. According to FSI's management, the wholesale market for crops that are capable of benefiting from the use of TPAs is about $2bn. So far this year, FSI saw a strong decrease in first quarter revenue for TPAs for agriculture use. In addition to TPA use in agriculture, TPAs are also an efficient, eco-friendly way of treating oilfield water to prevent pipes from being backed up with mineral scale.
In terms of revenue, the sale of TPAs has accounted for more than 90% of FSI's revenue over the last two years, which makes it an extremely critical component for FSI's success. In 2011 and 2012, the sale of TPA's generated revenue amounting to $14.4mm and $15.5mm, respectively. Furthermore, this indicates that on a YoY bass FSI saw about 7% revenue growth in this segment alone. Overall, its TPA business is a major growth candidate with large projects in place for the next several quarters. Going forward, FSI's return to investors will heavily depend on the performance of this segment.
Market Performance
In the market, FSI is currently trading right around $1.20 per share, which is just about 13.78x its forward earnings. With the exception of the last month, its average daily volume traded has remained relatively stagnant and investors experienced very little price appreciation until recently. FSI is a small capitalization company with only 13.17mm shares outstanding, which makes its market capitalization approximately $16.33mm. Looking below, you will see FSI's performance over the last five years.
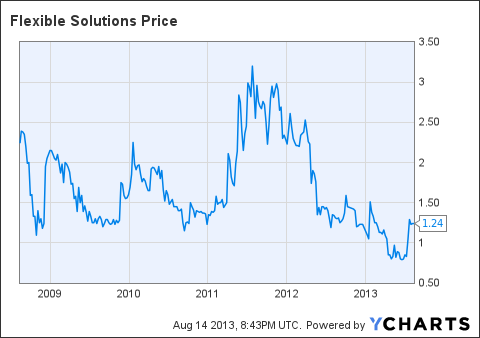
From a technical standpoint, FSI is rather attractive. First, its relative strength index (RSI) indication is right around 45, which is considered to be neutral on an overbought versus oversold basis. In case you do not already know, the RSI metric is commonly used to estimate the probability of a upward or downward trend in a security price, and you will find its quite simple to interpret. On a scale of 0-100, an RSI indication ranging between 20-30 suggest the stock has been heavily oversold, while a an RSI of greater than 60 is a sign the stock has been overbought. As we established, FSI's current RSI is neutral and appears to be declining. Right now, while its current RSI does not offer an ideal entry point, its nothing for investors to worry about. As its RSI approaches the 20-30 range, the probability of a dramatic upward trend in FSI's stock price will continue to increase. In addition to its RSI, its simple moving averages are also favorable on a number of durations. Currently, its SMA50 and SMA200 are 23.17% and 9.61% respectively. Overall, FSI's current price in the market is not a bad entry point for active investors, and in terms of share price appreciation, the upside potential is high. For FSI, technical analysis should not be the underlying decision for initiating a long-term position, however it is an excellent tool for achieving a low cost basis on an initial investment.
Financials
As mentioned earlier, FSI's operations are divided between the United States and Canada. Therefore, the revenue generated from each geographical location depends to an extent on the overall condition of the economy as well as external factors pertaining to a specific region. Generally speaking, the majority of FSI's revenue stems from its operations in the United States. However, a fair portion does come from Canada, and it's important that investors recognize this. Below is a chart showing the dollar amount of revenue generated in 2012 and 2011 by Canada and the United States, respectively.
(click to enlarge)
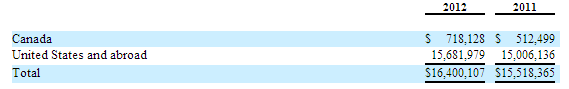
On a YoY basis, FSI's revenue has experienced adequate growth for a growing company. While we would have liked to see a larger increase in revenue from 2011 to 2012, its important to keep in mind FSI is still growing and by no means has reached its full market potential. Here's a graph depicting the changes in its revenue over the last five years:
(click to enlarge)
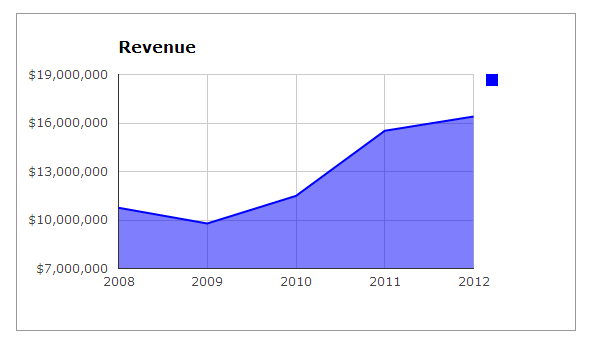
Despite the miniscule decrease in 2009, its overall revenue growth over the last five years is quite favorable. In 2009, its revenue came out to $9.783mm, and within just four years, its revenue increased by nearly 68% to $16.4mm at the end of 2012. Additionally, FSI is positioned to benefit from improving economic conditions. As we saw earlier, a larger percentage of its revenue is derived from the sale of TPAs. Given these products are widely used by agriculture producers, the fact of whether or not they purchase these products will depend on profitability at their level. In other words, FSI is well positioned to benefit from upward sloping cost curves for any of the crops in which its product can be used. For example, many farmers that produce corn are avid users of FSI's TPAs, and as long as the price of corn remains high enough to where the farmers profit margin allows for it to purchase TPAs, farmer will. This is solely due to the cost savings associated with using the product. Overall, there is a positive correlation between the amount of farmers that use FSI's TPAs and the current price of corps in commodity markets.
Before we shift gears and focus on FSI's balance sheet, it's important we take a look at two more things on the profitability side -- its gross and operating profit margins. Below, you will see I have constructed a comparison of the three accounts, including revenue, cost of goods sold, and gross profit. Excluding 2009, you will see that FSI's gross margin experienced relatively fair growth throughout 2011, and then declined in 2012 even though its revenue continued to increase. As you can see, this can be attributed to a higher cost of goods sold for this period, which was not proportional with respect to the increase in revenue.
(click to enlarge)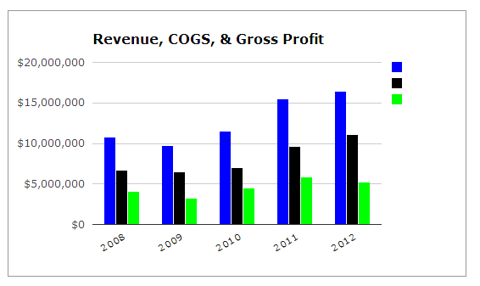 Furthermore, FSI's operating income in 2012 suffered as well due to changes in its cost structure. Across the board, its operating expenses in 2012 increased to $5.306mm from $4.546mm, which is an increase of almost 17%. Let's take a look:
 Furthermore, FSI's operating income in 2012 suffered as well due to changes in its cost structure. Across the board, its operating expenses in 2012 increased to $5.306mm from $4.546mm, which is an increase of almost 17%. Let's take a look:
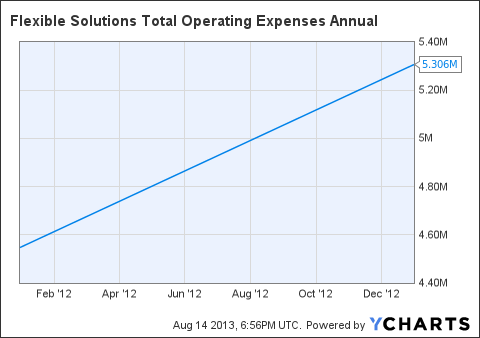
If you were to take a look at the various items under operating expenses on its balance sheet, there are not any items that reveal a distinct variation from YoY, except for its administrative salaries and benefits, which increased quite a bit. In 2011, FSI expensed $362,807 for administrative salaries and benefits, and in just one year, this figure increased by almost 120% to $792,927. In my opinion, that was simply too much. Going forward, I do not expect to see any further increase of any significance in this account. So far in 2013, its financials for the first two quarters reveal little variation in its cost structure, which I expect to continue.
Next, it's important we take a look at FSI's balance sheet in order to understand its capital structure. This will also help us determine its position in terms of both solvency and liquidity, which are both essential for growth in the long- and near-term, respectively. Historically, FSI's capital structure has been strong and relatively comparable to other firms operating within the same industry. Right now, its current capital strucutre supports a debt to equity ratio and long-term debt to equity ratio 0.34 and 0.13, respectively. Both of these metrics are considerable low and highly attractive on a stand alone basis. Below you will see that over the last five years its debt to equity ratio has increased slighly, but becuase it's still so low, it's nothing investors need to worry about.
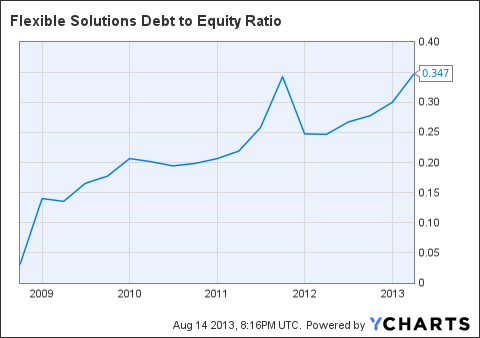
FSI Debt to Equity Ratio data by YCharts
Furthermore, its important to note that FSI's short-term working capital policy is adequate, which suggests FSI is not at risk for experiencing any short-term liquidity issues. Also, as you saw, FSI's long-term debt to equity is fairly low. And given its little need to acquire additional or extend pre-existing long-term debt issuances, we can assume its solvency is sufficient enough to sustain operating in the long-run. In order to be sure, let's take a look at its current and interest coverage ratio, which both reflect short- and long-term liquidity needs.
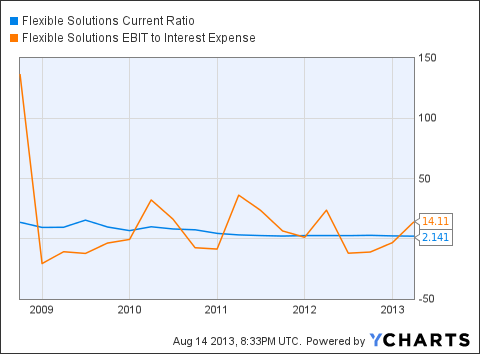
FSI Current Ratio data by YCharts
As you will see, both ratios are favorable and do not signal any concerns. Its current ratio is above two and its interest coverage ratio (EBIT/Interest Expense) is favorable high at 14.11. Typically, an interest coverage ratio is not this high, however it tells us that FSI is more than capable of making any interest payments on long-term debt that come its way. Additionally, a high interest coverage ratio is beneficial for FSI because it provides management with the ability to take on a higher interest expense without an issue, and recently, this has been the case. And over the last five years, you will see that its interest expense has increased quite a bit.
(click to enlarge)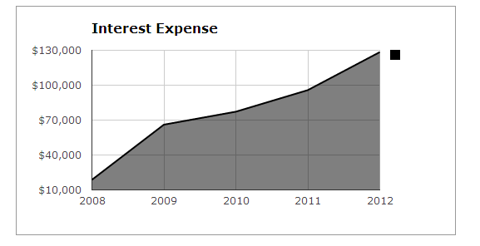

Valuation
As you saw earlier, FSI's stock is trading right around $1.24, and at this price, its common shares offer pretty solid value for active investors looking to capitalize on a simple market inefficiency. Broadly speaking, the stock is clearly undervalued and the upside potential is quite favorable, yet more importantly -- realistic. This next section will provide investors with a forward looking perspective of what to expect over the next six months in terms of FSI's share price.
It's important to recognize that traditional stock valuation techniques used for a firm in its early growth stage can produce outputs that are often unfavorable or unrealistic. For instance, the presence of negative free cash flow is fairly common among firms in this stage, and it's a prime example of one attribute that can make valuation a little tricky. Right now, FSI's free cash flow trailing to maturity is negative, but should not be a major area of concern.
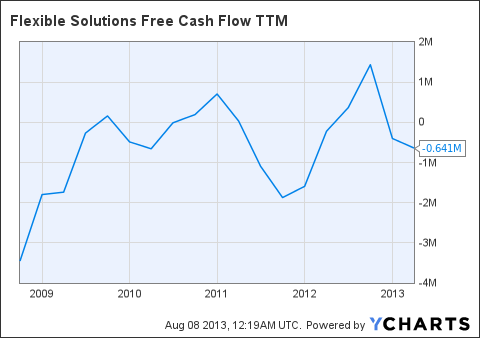
FSI Free Cash Flow TTM data by YCharts
In practice, the interpretation of negative free cash flow usually suggests two things: a firm is not generating real earnings or it's pumping excess capital into capital expenditures to fund growth options. Historically, FSI has been capable of generating real earnings, and its operating cash flow generated in the past exists to reflect this. Although its current earnings could be better, the primary reason FSI's free cash flow is negative is because the firm is still growing. For growing firms, it's quite common to see very little, if any positive free cash flow. Varying amounts of capital expenditures and investments in operating assets from quarter to quarter tends to deteriorate the stability of free cash flow for these firms. Therefore, valuation models that use free cash flow will likely yield skewed estimates. However, in order to avoid these complications, I used a modified version of the asset-based valuation approach.
To start, I took FSI's current total asset and liability figures and adjusted these figures to exclude depreciation on the asset side as well as short-term accounts payables in the current portion of the total liabilities. After taking the difference between total assets and liabilities, I divided the figure by the total of common shares FSI currently has outstanding. These calculations allowed me to arrive at a asset-based share price value of $1.19. Now if w assume that FSI continues to trade at its average price to book ratio of roughly 1.7x, this suggests FSI's implied share price should be around $$2.02. This is the theoretical price of what FSI should be trading in the market at. In other terms, this also suggests that FSI is currently undervalued by about 60% in the market. Additionally, as FSI's operating results continue to improve over the second half of 2013, I would not be surprised if this inefficiency is quick to become priced in.
Risk Assessment & Investor Concerns
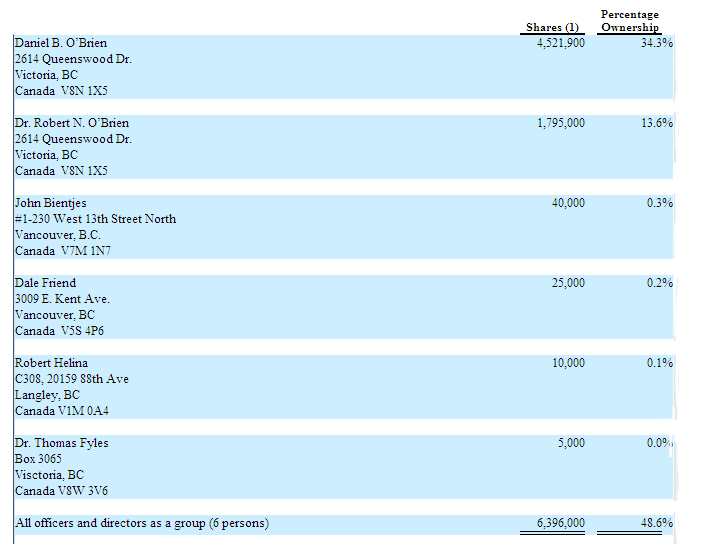
FSI's management clearly has a strong interest in the company and I do not see the potential for any risk to arise from management's interest being misaligned with the interest of shareholders'. Below is a chart I retrieved from FSI's 10-K for the period ending December 2012. As you will see, a total of six insiders own 48.6% of FSI's common shares outstanding. Over the last two quarters, there has been relatively little change. These six insiders still own roughly 48% of all FSI's common shares outstanding.
(click to enlarge)
Focusing on business and operational risk, there are a couple of things investors need to take into consideration. First, FSI's large dependence on few select customers has the potential to be a game changer in terms of revenue. Adverse economic conditions across industries in which its end consumers operate can heavily influence sales growth and cause inventory to pile up. FSI has started to expand its customer base, but is currently an ongoing process. Second, the performance and volatility in commodity markets has to an extent an impact on the sale of TPAs. Given the vast majority of its TPAs are sold to consumers in the agricultural industry, the price volatility of commodities such as corn has the potential to influence sales. TPAs are beneficial for farmers who cultivate a wide variety of crops because they are a cost effective means for conservation and increasing agricultural yields, however the price of crops must remain high enough to where its worth while for farmers to continue purchasing the product for there benefit.
In terms of the risk associated with FSI's stock in the market, it reveals a relatively low level of volatility for a small capitalization company. Using FSI's holding period returns for the last two years, I regressed its returns with respect to the returns of the S&P 500 to provide investors with a quantitative risk metric for comparative purposes. The regression function revealed a firm specific beta for FSI of approximately 0.85, and given the market is to be considered neutral with a beta of 1, this is extremely low.
Bottom Line
FSI is small company and has by no means reached its full market potential. FSI's strong capital structure will continue to provide its operations with the funding necessary to meet any short-term liquidity needs. Additionally, solvency is not an issue and FSI is in a strong position with the capability of financing its operations in the long-run. Although the several changes made to its cost structure in the latter part of 2012 set back its operating margin from the previous year, its revenue continued to increase YoY and I do not foresee another increase in operating expenses for this year like we saw previously.
At just above $1.20 per share, FSI offers substantial upside potential. From an investment standpoint, its low level of volatility suggests minimal downside risk for active investors who wish to capitalize on short-term trades. However, the cost effective solutions provided by its highly specialized product line make it a long-term investment that's highly worth considering.
Sources : Google Finance, Yahoo Finance, FinViz, Bloomberg Market Data, YCharts, FSI's 10-K retrieved from sec.gov, FSI's Company Website, and FSI's Product Brochures.
No comments:
Post a Comment