TGC Industries (TGE) is a small capitalization company in the basic materials sectors. TGE's operates as a service provider of seismic data acquisition services catering to the needs of firms within the oil and gas exploration and production industry. TGE is a profitable company that derives its margins from several keen advantages, including its widespread operations, a highly specialized service menu, and a customer base that's sustainable.
Over the last few years, the oil and gas exploration and production industry has seen rapid growth as a result of increased activity on the exploration side. Majority of the firms within this industry are operating in a mature stage, and therefore, tend to have the capital needed to exert a consistent demand for TGE's services. Given the recent demand for TGE's services has been relatively stable, we can assume this holds true. TGE's position in the market is unique, because the demand for its services will reflect an increase much similar to the growth rate of its customer's business, which later we will see is quite favorable.
Overall, TGE's strong financial position will provide it with the solvency necessary to sustain its operations in the long run and provide it with enough capital on hand to adjust its service menu to ensure it addresses the needs produced by outward shifts in the demand curve for its services. The sustainability of TGE's customer base is by far the most lucrative resource at its disposal, however its current valuation is what I find most enticing. Not only do TGE's basic valuation metrics provide a sound indication that its common stock is undervalued, but computing its intrinsic value reveals a substantial difference between what investors have priced into the market versus what TGE is truly worth. As of now, investors have yet to exploit this market inefficiency, and a feasible investment stands to exist. This article will provide an overview of the company as well as its operations, highlight its recent performance, and discuss the characteristics of the industry that TGE's customers operate in. Additionally, this article will include a detailed segment covering its valuation and provide investors with a sense of what to expect in terms of its stock price for the end of 2013. To conclude, I will outline several potential risks that investors should be mindful of.
Company Background
The start of TGE's business dates back to as early as 1980 where it was it began operating under Supreme Industries, Inc. as a wholly owned subsidiary called Tidelands Geophysical Co., Inc. Several years later, in June of 1986, the Board of Directors of Supreme Industries and Tidelands Geophysical approved a spin-off of substantially all of the shares of Tidelands owned by Supreme Industries. Ultimately, the spin-off resulted in the distribution of its shares in the form of a stock dividend that was paid to Supreme Industries' shareholders. This marked the original formation of Tidelands Geophysical Co. Inc., which today is known as TGC Industries, Inc.
Today, TGE is incorporated in Texas and maintains control over its wholly-owned subsidiary, Eagle Canada, which is a Delaware corporation. TGE is one of the leading providers of seismic data acquisition services and through its operations is actively engaged in the geophysical service business of conducting three-dimensional surveys for its clients in the oil and gas exploration and production industry. As of December 31, 2012, TGE operated a total of 14 seismic crews. Nine of the crews are located in the United States, while the other five remain stationed in Canada. The primary goal of these crews is to provide seismic data to companies that are actively exploring and working towards developing oil and natural gas on land as well as in land-to-water transition areas.
As you are starting to understand, TGE's services cover a vast landscape and provide critical need-to-know information for the dominant players in the oil and gas exploration and production industry. To maintain a competitive edge, TGE acquires its geophysical data using the latest three-dimensional survey techniques. TGE's 10-K goes into further detail, on the process:
"We introduce acoustic energy into the ground by using vibration equipment or dynamite detonation, depending on the surface terrain and subsurface requirements. The reflected energy, or echoes, is received through geophones, converted into a digital signal at a multi-channel recording unit, and then transmitted to a central recording vehicle. Subsurface requirements dictate the number of channels necessary to perform our services."
Basically, TGE takes on the full costs associated with obtaining the-state-of-the-art equipment to obtain the data as well as the costs associated with processing and interpreting the data. Then the results of the data are then used to generate the final deliverable to customers, which is simply a three-dimensional model that helps reduce discover costs and improve recover rates from existing wells. For further details on its operations, visit TGE's company website.
In the market, TGE is trading at about 20x its 2012 earnings per share. With a total of 22.81 mm shares outstanding, its market capitalization is small barely tipping $200 mm. In terms of technicals, I cannot say TGE offers a perfect entry point at the moment, but its 30-day relative strength index (RSI) indication does not reveal anything investors should be concerned about. Currently, its 30-day RSI indication is 43.5, which lies right about in the middle. and should be viewed as neutral.
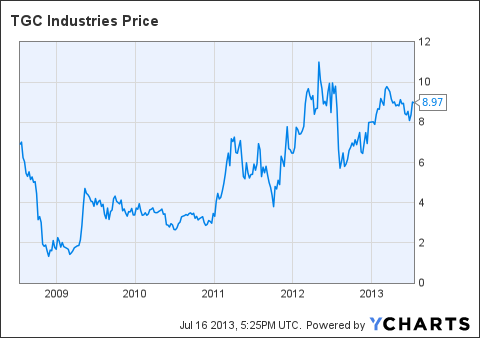
(Click to enlarge)
TGE data by YCharts
The One Time "Being Needy" Doesn't Get Old
Broadly speaking, there is a widespread need for TGE's services. And going forward, the need will only magnify as positive growth is experienced by its customer base. While the probability of this growth trend continuing is highly favorable, the underlying probability of zero growth or even a decline always exists. Therefore, in order to accurately make an informed prediction regarding TGE's growth potential, we must start by shifting our focus directly on its customer base.
As mentioned earlier, TGE's customer base is comprised of the companies operating in the oil and gas exploration and production industry. This general structure of this industry entails several large firms operating in a mature stage that dominate in terms of revenue market share. Just for reference, some of these firms are Apache (APA), ConocoPhillips (COP), Exxon Mobil (XOM), BP plc (BP), National Iranian Oil Company, and Petroleo Brasileiro Petrobras SA (PBR). In the last several years, TGE along with several of its peers in the Oil and Gas equipment services industry have had the luxury of being able join the ride and prosper off the massive growth experienced by companies operating in the oil and gas exploration and production industry. Increased exploration activities among these companies in the United States and Canada has had a major impact on the demand for TGE's services.
So far, we have established the idea that growth in this industry does not seem to be an issue, but let's quantify growth in terms of revenue to make this easier to understand. According to IBIS World, in 2008, the total revenue generated by oil and gas exploration and production companies globally was around $4.2 trillion. In the following year, revenue declined by 40% as a result of the 2009 credit crisis, however the significant revenue increases over the next two years made up for more than their fair share. After 2009, the YoY revenue increases in 2010 and 2011 alone were almost enough to entirely offset the damage done in 2009. As you can tell, this setback was purely temporary, and the industry is only beginning to excel beyond its performance we saw in 2008. Going forward, the industry's total revenue for 2013 is projected to increase by 3% YoY to approximately $4.5 trillion by the end of the year. From 2008, this is an increase of roughly 7.14%, which annualized equates to 1.42%. While this may seem to be a bit of a slowdown in terms of its revenue increases on a YoY basis, it's important to understand that the oil and gas exploration and production industry has finally recovered from the nasty turn it took in 2008. With that being said, YoY revenue growth in the 2% to 3% range should not be perceived as slow or inadequate growth -- it's rather favorable.
Operating Performance
Over the last five years, TGE has grown tremendously. For starters, let's take a look at its revenue:
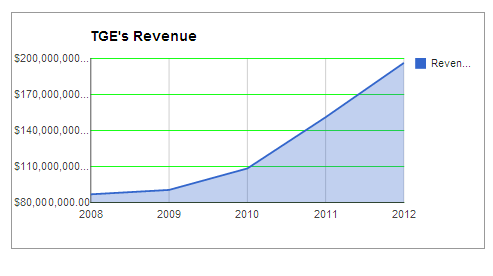
In just a five-year period, TGE's revenue has increased by nearly 125%. More importantly, it's crucial to note what did not happen in 2009. While the dominant players in its customer base had a rough time following the credit crisis, the impact on TGE's performance was much smaller. In fact, the impact was so insignificant that you cannot even tell by looking at its revenue. It's TGE's net income that reveals the change. Let's take a look:
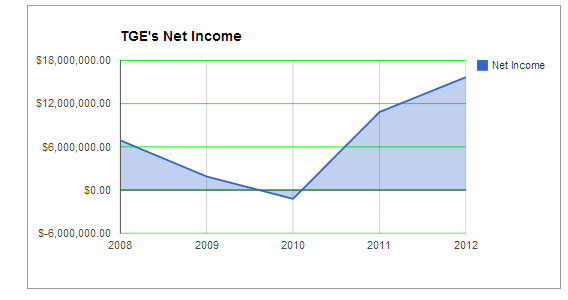
Since 2010, TGE's net income has remained positive and is continuing to increase. Additionally, when analyzing earnings it becomes even more crucial to look at the cash flow generated by operations. Operating cash flow will allow us to determine whether or not a firm is capable of generating real earnings and it will expose any accounting gimmicks that may have potentially been used to distort net income. Overall, TGE has a history of producing steady cash flows. With the exception of 2010, for the last five years TGE has generated cash flow from operations in excess of capital expenditures each year leaving a positive amount of free cash flow available to shareholders.
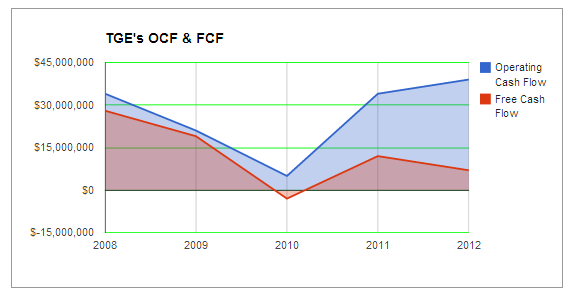
Going forward, I expect the difference between operating and free cash flow to shrink as its cost structure stabilizes. In 2012, capital expenditures alone were roughly $32 mm, and based on past performance, this is not shocking. If we take a look at the change in total assets over time, the large amount of cash outflows for investing activities makes sense.
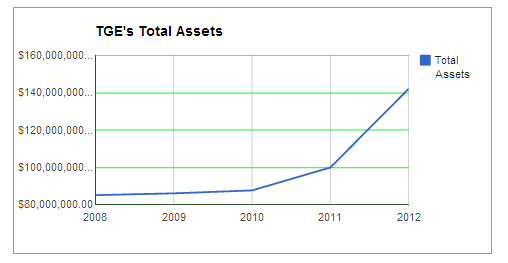
TGE's current free cash flow trailing to maturity is about $15 mm, and by the end of 2013, I expect the final free cash flow figure to be closer to $17 mm. Regardless, as cash outlays for investing activities are reduced, investors should see a substantial increase in free cash flow by the end of 2013.
Capital Structure
As noted earlier, TGE's debt is hardly a concern. Right now, its current debt-to-equity ratio is about 31%. With only $13.94 million in long-term debt on its balance sheet, its long-term debt-to-equity ratio is even more appealing at only 17%. Now that we have eliminated solvency as a potential set back, let's take a look at TGE's short-term financing needs. Below, you will see a figure I retrieved directly from TGE's most recent 10-K displaying all of its current contractual obligations.
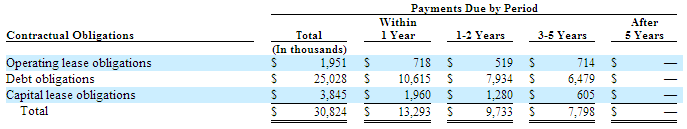
As shown in the figure above, TGE's total debt outstanding is $25.028 mm. Of this total, roughly $11.088 mm is debt tied to short-term financing needs, which means repayments on this debt will be due in less than a year. Up to this point, TGE has not revealed any signs of major liquidity issues, but with a current ratio of only 1.6 we cannot eliminate the possibility of short-term financing creating an issue down the road. Additionally, the fact there is more short- than long-term debt suggests the use of high fixed costs is relatively low. Furthermore, this indicates TGE exhibits a lower degree of financial leverage, which means that are not faced with the risk of performance being determined by whether or not it's capable of incurring high fixed costs.
Valuation
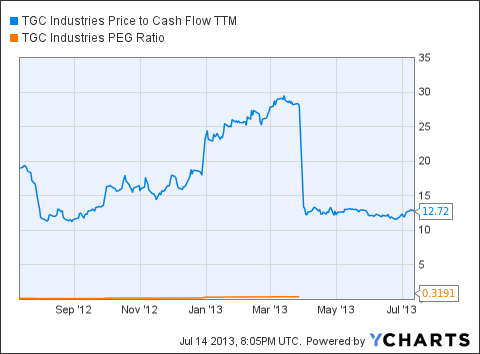
TGE is extremely undervalued and there is no question about it. For starters, let's begin with taking a look at several of its price multiples as they are an excellent way to begin illustrating this story. In the figure below, you will notice its current price-to-cash flow (P/FCF) and price-to-earnings growth (PEG) ratios are 12.72 and 0.31, respectively.
(Click to enlarge)
TGE Price to Cash Flow TTM data by YCharts
Now on a standalone basis, these valuation metrics are not extremely useful. However, the combination of the two falling within specific constraints for a given period of time is a different story. The combination of a P/FCF ratio of less than 15 and a PEG ratio of less than 1 is a strong indication that the stock is undervalued.
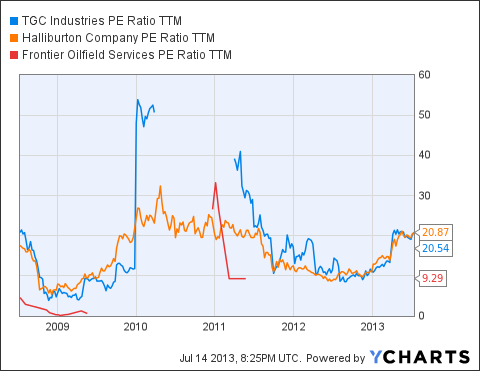
Like other companies operating in the Oil and Gas equipment services industry, TGE has never really traded at a consistent price-to-earnings ratio. This can be attributed to the large amount of earnings variability created by the negative earnings in 2010. As you will see below, TGE has been trading at about 20.5x its 2012 earnings per share.
(Click to enlarge)
TGE PE Ratio TTM data by YCharts
In 2012, its earnings per share came out to $0.72, which is based on the diluted weighted average number of shares of 23.3 mm. For the period ending March 31, 2013, TGE reported earnings per share of $0.27, which was just the first quarter of 2013. TGE will report its earnings for Q2 on July 29th. Following this announcement, we will have a much better idea of what to expect by the end of 2013. But as of now, I anticipate its earnings per share will easily exceed its diluted total for 2012. Its Q1 earnings alone is about 40% of its total earnings in 2012, and after Q2, it will exceed well over 60%.
In addition to these favorable metrics, TGE is trading at a deep discount to its intrinsic value. TGE's true value is best reflected through the intrinsic value of its operations and the model I am about to show you will compute this for you. In the model below, I used a conservative free cash flow estimate for the end of 2013, TGE's weighted average cost of capital as the risk-adjusted discount rate, and last, a perpetual growth rate of 3%. To derive the intrinsic value of operations, the model simply divides the free cash flow estimate projected one year forward by the difference between the weighted average cost of capital and the perpetual growth rate. In order to provide a more conservative estimate, I used TGE's current trailing to maturity cash flow figure in place of the $17 mm I projected earlier.
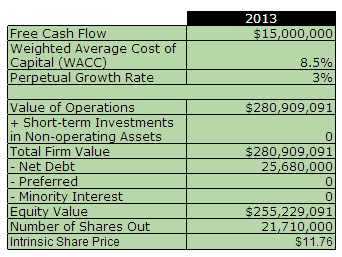
After computing the value of its operations, I subtracted net debt to arrive at the intrinsic value of equity. Then divided that figure by the number of shares outstanding to arrive at the true value per share. As a result, the model indicated its implied share price should be right around $11.76, which suggests TGE is undervalued by roughly 30% given its current price in the market. It's clear without a doubt, there is a strong case for value. TGE is on sale for only a fraction of what it's actually worth, and with that being said, it's now time for active investors to take advantage of this intriguing upside potential.
Investor Concerns
While I feel being a solid growth candidate with attractive valuation makes TGE a strong buy, there are several risks investors need to be aware of. First, it's obvious that poor performance in the oil and gas exploration and production will have an impact on TGE's performance, but investors should be mindful of the "lagged" effect. Poor performance through the profit margins of its customers will also impact TGE's margins, but it may not be noticeable for a couple of quarters down the road. Therefore, it's important for investors to stay up to date on the operating performance of TGE's customers. Second, it's important to recognize that TGE competes in an industry that is highly competitive in nature. The services its operations provide are lucrative, but expensive in terms of short-term financing costs. In fact these services play an essential role in an exploration company's ability to maintain a competitive edge, big players in the industry do not have an issue paying a premium for these services. As long as TGE maintains an adequate level of solvency like it historical has, it will not have an issue meeting the costs necessary to sustain its operations. However, if TGE does not maintain an adequate level of capital, then there is an open opportunity for firms with financial resources to enter the market and take away from TGE's business.
Bottom Line
It's clear that the performance of the oil and gas equipment services industry is fairly correlated with the performance of the oil and gas exploration and production industry. The major exploration and production companies such as XOM and BP typically generate higher margins than companies such as TGE, however during economic downturns companies such as TGE tend to not suffer quite as bad. TGE is a profitable company with a strong financial position that is well positioned to grow over the next couple of years. Its lucrative customer base comprised of some of the largest publicly traded companies adds to the sustainability of its business. The oil and gas exploration and production industry is continuing grow and it's expected that we will see about 3% YoY growth industry wide by the end of 2013. Additionally, TGE's customer base exhibits a consistent demand. Its customers are needy, and in this case, it's not an issue. As long as TGE effectively maintains an appropriate capital budget, it will be able to cater to any shifts in the demand for its services. As you saw, TGE's valuation is attractive as it continues to trade at a severe discount to its intrinsic value. Its 2013 Q1 earnings were solid and its intrinsic valuation will only continue to augment as its future earnings translate into free cash flow. A feasible investment exists and investors are positioned to benefit from a short-term upside of as much as 30%.
Sources: Google Finance, TD Ameritrade, YCharts, Bloomberg Market Data, sec.gov, and FinViz.
No comments:
Post a Comment