Terex Corporation (TEX) is mid-sized company with a market capitalization of around $3.22 billion operating in the industrial goods sector. Right now, Terex is trading at about $29 per share. Although its debt to equity ratio remains a high, the recent growth it has seen in its earnings per share along with basic valuation metrics suggest Terex's stock is undervalued. Both its technicals and fundamentals suggest a favorable upside is highly probable in the near term. It's now time for investors to take that into consideration. This article provides a brief overview of Terex's operations as well as its recent performance in the market. Additionally, investors will be provided with seven reasons why Terex is a strong buy at its current valuation. To conclude, I will highlight several areas for concern that investors should bear in mind.
Company Background
Terex is an equipment manufacturer of specialized machinery products that was incorporated in Delaware in October of 1986. Since 1986, Terex has changed significantly. The large amount of acquisitions Terex has made over the last ten years has greatly enhanced the position in the market for industrial goods. Today, Terex's operations are widespread across the globe and are highly diversified in nature. The primary focus of Terex's business is centered around providing its customers with timely solutions that incorporate degree of specialization across a wide breadth of applications such as construction, infrastructure, quarrying, mining, manufacturing, shipping, transportation, refining, energy, and utilities industries. For simplicity, Terex's operations can be easily divided into five business segments:
- Aerial Work Platforms
- Construction
- Cranes
- Material Handling and Port Solutions
- Materials Processing
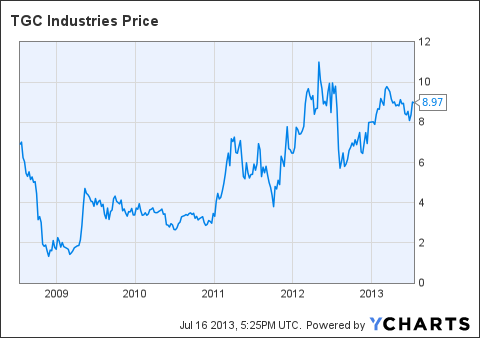
As mentioned earlier, Terex is trading right around $29 per share. With 110.8 million shares outstanding, its market capitalization is roughly $3.22 billion. In terms of ownership, Terex's stock appears to be a prime target for institutional investors who currently hold nearly 95% its common shares outstanding. Insiders only own about 3.8%, which leaves very little for individual investors. Recently, there has not been any significant transactions by either institutional investors or insiders. In the last three months, institutional and insider holdings increased by roughly 0.46% and 10.44%, respectively.
TEX data by YCharts
7 Reasons To Buy Terex At $29 Per Share:
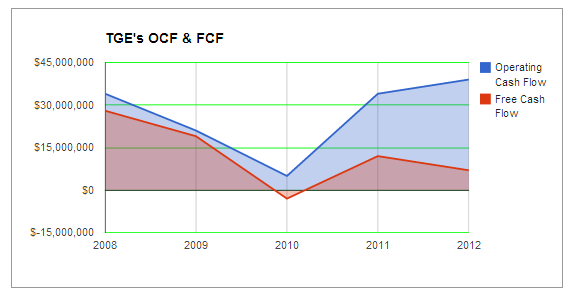
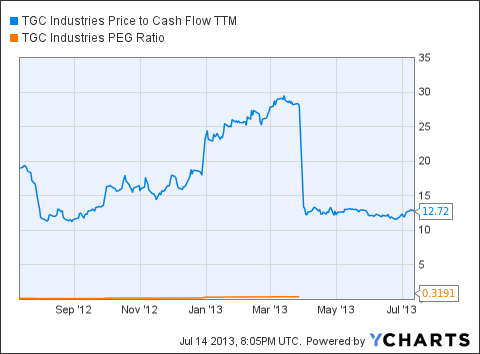
#1 Terex's basic valuation metrics alone suggest its stock is undervalued in the market. Currently, its price-to-free cash flow ratio is only 9.35, which is favorable given a P/FCF ratio of less than 15 is a strong indication a stock is undervalued. In other terms, this also tells us that in excess of capital expenditures Terex has about $3.12 in free cash flow (FCF) available per share, which equates to total FCF of roughly $344 million. For a mid-sized company, Terex's level of FCF TTM is adequate, but do not expect it to stay the same. Over the past two years, Terex's FCF has experienced significant growth, and going forward, it appears as if this growth will continue. Let's take a look:
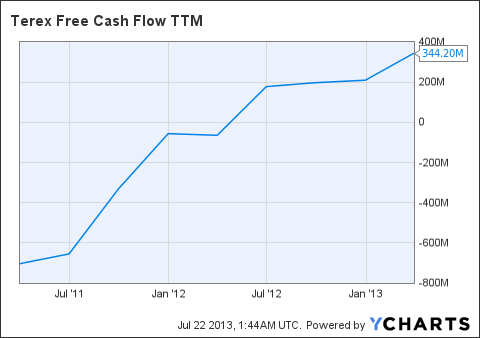
TEX Free Cash Flow TTM data by YCharts
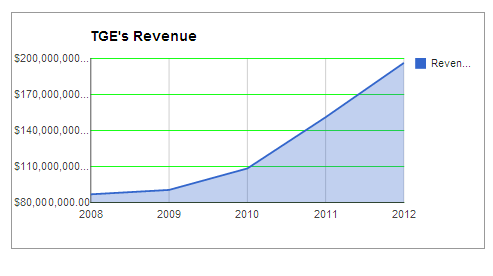
#2 Improvements in earnings will cater to a higher valuation and upside potential for investors. First, its important to note that on a five year time frame its earnings growth is not favorable. Terex's EPS growth over the last five years is actually negative displaying a decline by about 29%, however a more narrow time frame presents an entirely different story. First, let's take a look at its changes in revenue over the past couple of years.
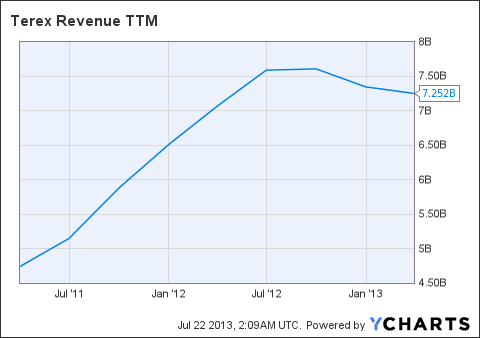
TEX Revenue TTM data by YCharts
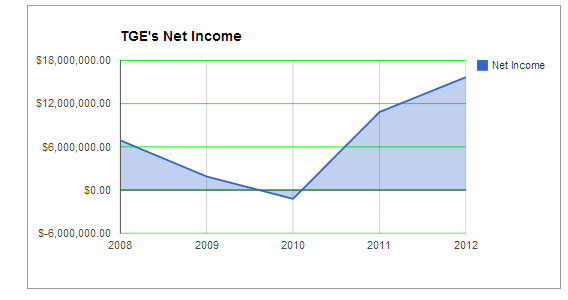
Evidently, Terex's revenue has experienced excellent growth over the last two and a half years. For the fiscal year ending 2012, Terex's total revenue came out to $7.25 billion. As you are beginning to understand, Terex has made significant changes that have not only allowed its business to expand, but also allow it to sustain higher margins. And this is reflected through its EPS growth. Let's take a look:
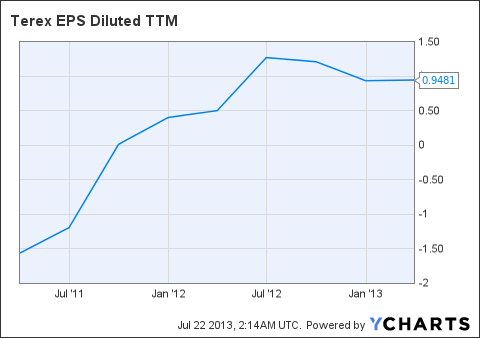
TEX EPS Diluted TTM data by YCharts
So far this year, its EPS has already increase by nearly 160%, and that's only two quarters of operating results. Going forward, analysts estimates continue to be favorable. Analysts are anticipating its EPS will increase by about 50% in the next year.
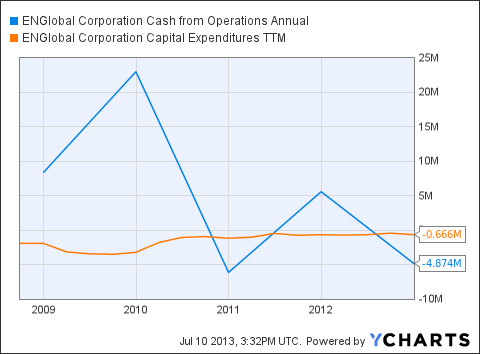
#3 Terex is in position to benefit from changes made to its cost structure. Along with margin improvement comes cost reduction, which is exactly what Terex has done. Terex has dramatically improved its EPS and increased its overall profit margin by reducing the aggregate amount of capital it allocated to variable as well as fixed costs such as capital expenditures. Let's take a look:
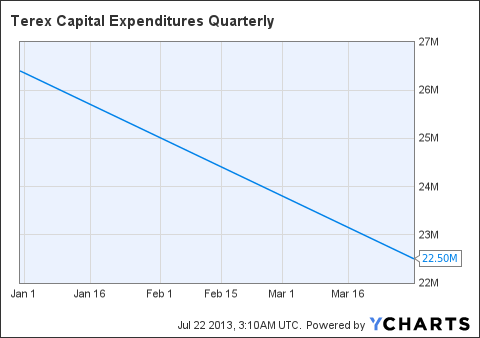
TEX Capital Expenditures Quarterly data by YCharts
As you can see above, Terex has significantly decreased the amount of cash it allocates to investing activities. The decrease in capital expenditures is attractive from an investment standpoint because it allows for a higher level of FCF, which indirectly impacts its valuation. Holding all other factors constant, a higher level of FCF will increase the intrinsic value of its common stock.
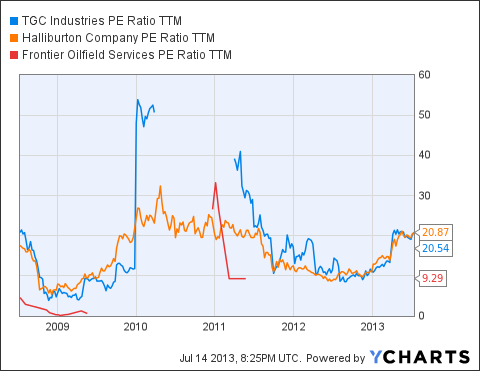
#4 Terex competes in an industry that is extremely competitive, however the diversified nature of its product/service venue will allow Terex to maintain the market share necessary to compete in the industry. A few of Terex's competitors include Caterpillar (CAT), Manitowoc (MTW), Manitex International (MNTX), and Deere (DE). Although the magnitude of Terex's revenue is much smaller than some of the bigger competitors such as CAT and DE, the increase in Terex's revenue shows that it's still capable of gaining new business.
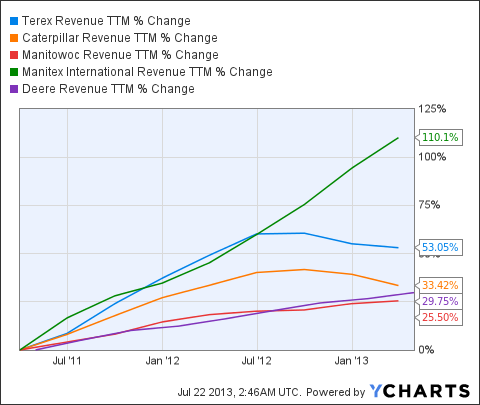
TEX Revenue TTM data by YCharts
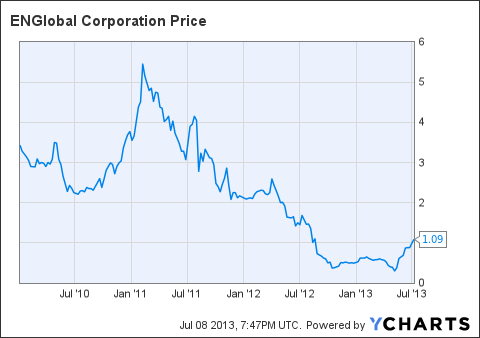
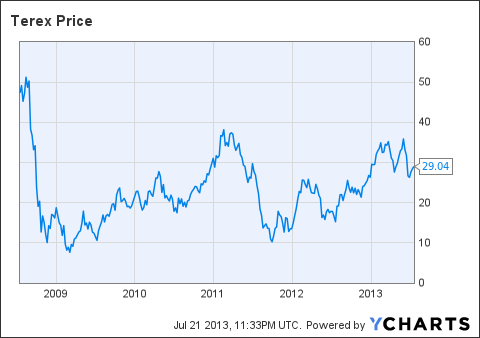
#5 From a technical standpoint, Terex is quite attractive. Its 30-day relative strength index (RSI) indication is relatively low at only 42.4, which does not suggest the stock has been over bought. However, an RSI indication falling between 20 and 30 would be ideal for initiation a position. And within the next month, it appears as if its RSI will reach the low 30s. In addition to the tedious metrics used by market technicals to determine the likelihood of a stock price moving one way or another, technical analysis, under rare circumstances, can also be used to generate price targets. And as rare as it may be, Terex's YTD price graph offers an excellent example as for how a price target can be determined using the underlying patterns and trends within its price.
(click to enlarge)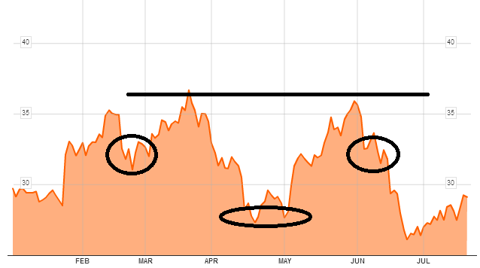

Looking at the graph above, you will see that I have highlighted three circles, which represents what is often called a inverse head and shoulders. The four key components have been illustrated by the shapes in the graph above and include the neckline (LINE), shoulders (circles), and the head (oval). The price target formula for an inverse head an shoulders pattern is: [Price Target = Neckline + (Neckline - Head)]. Therefore, this graph reveals a short-term price target ranging from about $28 to $30.
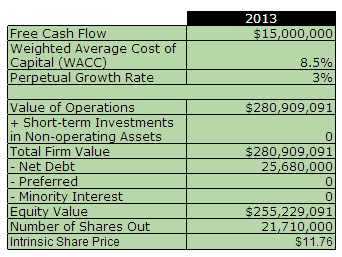
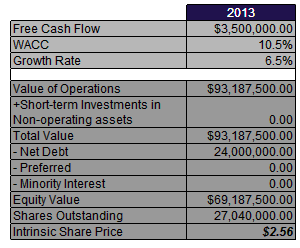
#6 Based on intrinsic value, the fair value of Terex's common stock is $34 per share. To compute this value, I used a variation of the corporate valuation model taking into account its FCF TTM, its current weighted average cost of capital, and a perpetual growth rate of 2.5%, which is fairly conservative. Note this is not by any means a price estimate. It's the true value of what Terex's common stock is worth right now. Overall, this suggests Terex is trading 17% below is fair value per share.
#7 Analysts seem to be on board as well. Of the seven analysts that cover the stock, the mean and median six month price targets are $35 and $36.50, respectively. In other terms, the mean and median price targets suggest an upside of 20.7% and 25.9%, respectively.
Bottom Line
While an excellent investment opportunity exists, there are several risk investors need to be aware of. As you saw, Terex's EPS made a dramatic turnaround this year. The vast majority of this can be attributed to major changes made to its cost structure. Therefore, going forward, it will be crucial Terex's management maintains an adequate level of control over its variable as well as fixed costs to prevent margin compression. In addition, its important for investors to know that Terex is affected by the cyclical nature of the different markets it serves. And given Terex's customer base is highly diversified among different industries, this risk is subject to vary greatly.
Overall, Terex is a profitable company with sound fundamentals. Its common stock is on sale trading at a hefty discount to its fair value. With that being said, now is an excellent time for active investors to initiate a position before this simple market inefficiency is exploited.
Sources: YCharts, Google Finance, Yahoo Finance, TD Ameritrade, FinViz, and Bloomberg Market Data.